Inverted Hammer Candlestick Pattern

The Inverted Hammer candlestick formation occurs mainly at the bottom of downtrends and can act as a warning of a potential reversal upward. It is important to note that the Inverted pattern is a warning of potential price change, not a signal, in and of itself, to buy.
The Inverted Hammer formation, just like the Shooting Star formation, is created when the open, low, and close are roughly the same price. Also, there is a long upper shadow, which should be at least twice the length of the real body.
When the low and the open are the same, a bullish Inverted Hammer candlestick is formed and it is considered a stronger bullish sign than when the low and close are the same, forming a bearish Hanging Man (the bearish Hanging Man is still considered bullish, just not as much because the day ended by closing with losses).
After a long downtrend, the formation of an Inverted Hammer is bullish because prices hesitated their move downward by increasing significantly during the day. Nevertheless, sellers came back into the stock, future, or currency and pushed prices back near the open, but the fact that prices were able to increase significantly shows that bulls are testing the power of the bears. What happens on the next day after the Inverted Hammer pattern is what gives traders an idea as to whether or not prices will go higher or lower.
Inverted Hammer Candlestick Chart Example
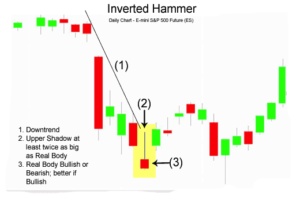
The chart below of the S&P 500 Futures contract shows the Inverted Hammer foreshadowing future price increases:
In the chart above of e-mini future, the market began the day by gapping down. Prices moved higher, until resistance and supply was found at the high of the day. The bulls’ excursion upward was halted and prices ended the day below the open.
Confirmation that the dowtrend was in trouble occured the next day when the E-mini S&P 500 Futures contract gapped up the next day and continued to move upward, creating a bullish green candle. To some traders, this confirmation candle, plus the fact that the downward trendline resistance was broken, gave them a potential signal to go long.
It is important to repeat, that the Inverted Hammer formation is not the signal to go long; other indicators such as a trendline break or confirmation candle should be used to generate potential buy signal.
The bearish version of the Inverted Hammer is the Shooting Star formation (see: Shooting Star) that occurs after an uptrend.
The information above is for informational and entertainment purposes only and does not constitute trading advice or a solicitation to buy or sell any stock, option, future, commodity, or forex product. Past performance is not necessarily an indication of future performance. Trading is inherently risky. Commodity.com shall not be liable for any special or consequential damages that result from the use of or the inability to use, the materials and information provided by this site.