Understanding Bullish Engulfing Patterns and How to Trade Them
Trading in the stock market or forex can be very rewarding, but it can also be confusing, especially for beginners. One tool traders often use is called a candlestick pattern. Among these patterns, the Bullish Engulfing Pattern is one of the most popular because it signals a potential reversal of a downtrend into an uptrend. In this article, we’ll dive deep into what a Bullish Engulfing Pattern is, how it works, and how you can trade it effectively.
What is a Bullish Engulfing Pattern?
Candlestick Basics
Before we understand the Bullish Engulfing Pattern, let’s briefly look at what a candlestick is. A candlestick is a way to display the price movements of an asset (like a stock or currency pair) over a specific time period. Each candlestick shows four main prices:
- Open: The price at which the asset starts trading at the beginning of the time period.
- Close: The price at which the asset stops trading at the end of the time period.
- High: The highest price the asset reached during the time period.
- Low: The lowest price the asset reached during the time period.
The body of the candlestick is usually colored. If the closing price is higher than the opening price, it is often colored green (or white), indicating a bullish candle. If the closing price is lower than the opening price, it is usually colored red (or black), indicating a bearish candle. The thin lines above and below the body are called wicks or shadows, showing the highest and lowest prices during the time period.
What is a Bullish Engulfing Pattern?
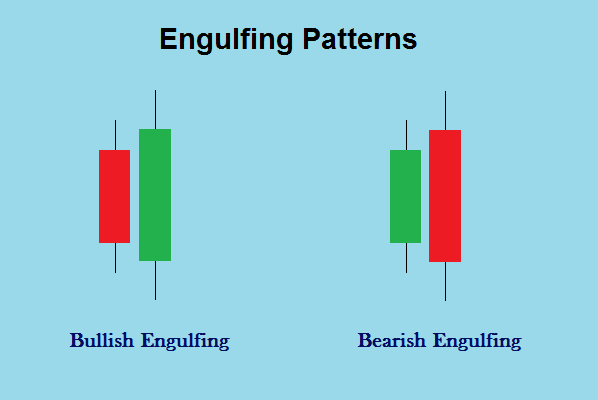
A Bullish Engulfing Pattern is a candlestick pattern that appears at the end of a downtrend. It consists of two candles:
- First Candle: A smaller bearish candle, which shows that the price closed lower than it opened.
- Second Candle: A larger bullish candle, which completely engulfs the first candle’s body, meaning the open and close of the second candle are higher and lower than the first candle.
Here’s a simple illustration:
- First Candle (Bearish): Small red (or black) body.
- Second Candle (Bullish): Large green (or white) body that covers the first candle entirely.
When you see a Bullish Engulfing Pattern, it signals that the buyers are now in control, indicating a possible change in trend from down to up. This is why it’s called “bullish”—the bulls (buyers) have taken over from the bears (sellers).
Why is the Bullish Engulfing Pattern Important?
The Bullish Engulfing Pattern is significant because it can help traders identify potential buying opportunities. When this pattern forms, it suggests a strong shift in momentum towards the buyers. This makes it a powerful tool for predicting potential upward price movements.
How to Identify a Bullish Engulfing Pattern
Identifying a Bullish Engulfing Pattern involves looking for the following key characteristics:
- Downtrend: The pattern should occur after a clear downtrend. This downtrend can be short-term or long-term, but the trend should be moving downwards before the pattern forms.
- First Candle (Bearish): The first candle should be a bearish candle with a small body. This candle represents the continuation of the downtrend.
- Second Candle (Bullish): The second candle should be a bullish candle with a body that completely engulfs the first candle’s body. The wick or shadow doesn’t need to be engulfed, just the body.
- Volume Increase: An increase in trading volume during the second candle can add more credibility to the pattern, suggesting strong buying interest.
Example of a Bullish Engulfing Pattern:
Imagine a stock has been declining steadily, showing a series of red candles. Then, one day, it opens lower than the previous day’s close but closes significantly higher than the previous day’s open. This forms a Bullish Engulfing Pattern, indicating that the buyers have entered the market aggressively, potentially marking the end of the downtrend.
How to Trade the Bullish Engulfing Pattern
Now that you know how to identify a Bullish Engulfing Pattern, let’s talk about how to trade it. Here are some steps and tips to consider when trading this pattern:
Step 1: Confirm the Downtrend
Before entering a trade, confirm that a downtrend is in place. You can use technical indicators like moving averages, trendlines, or price action analysis to verify that the trend is indeed down before the Bullish Engulfing Pattern appears.
Step 2: Identify the Bullish Engulfing Pattern
Look for the pattern at the end of the downtrend. Ensure the second candle completely engulfs the first candle’s body. This visual confirmation is crucial before proceeding to trade.
Step 3: Confirm with Volume
Check the trading volume during the formation of the second candle. An increase in volume adds strength to the pattern, indicating significant buying interest. High volume during the engulfing candle means many traders are confident in the potential reversal.
Step 4: Use Additional Indicators
While the Bullish Engulfing Pattern is powerful on its own, using additional indicators can help increase the probability of a successful trade. Consider using:
- Moving Averages: A crossover or bounce from a moving average can confirm the bullish reversal.
- Relative Strength Index (RSI): An RSI reading below 30 (oversold) can add weight to the pattern, suggesting a potential price increase.
- MACD (Moving Average Convergence Divergence): A bullish crossover in the MACD can provide further confirmation.
Step 5: Set Your Entry Point
You can enter a trade once the Bullish Engulfing Pattern is confirmed. Here are a couple of common entry strategies:
- Aggressive Entry: Enter immediately after the bullish engulfing candle closes. This is a more aggressive approach and aims to capture the initial reversal move.
- Conservative Entry: Wait for additional confirmation, such as a break above a resistance level or a trendline. This might lead to entering at a slightly higher price, but it provides more assurance that the reversal is genuine.
Step 6: Set Stop-Loss and Take-Profit Levels
Setting a stop-loss is essential to protect yourself from unexpected market movements. Place your stop-loss just below the low of the Bullish Engulfing Pattern. This ensures that if the price moves against you, your losses are minimized.
For take-profit levels, you can use several methods:
- Fixed Ratio: Target a specific reward-to-risk ratio (e.g., 2:1), meaning if your stop-loss is 10 points away, aim for a 20-point profit.
- Resistance Levels: Identify nearby resistance levels as potential take-profit targets.
- Trailing Stop: Use a trailing stop to lock in profits as the price moves in your favor.
Step 7: Monitor the Trade
Once you enter the trade, keep an eye on the market. Look for signs of strength or weakness in the price movement. If the price continues to rise, consider moving your stop-loss to break even or better, securing your profits as the trade progresses.
Step 8: Exit the Trade
Exit your trade once your take-profit level is hit, or if you see signs of reversal against your position. It’s essential to stick to your trading plan and not let emotions dictate your decisions.
Examples of Trading Bullish Engulfing Patterns
Let’s look at a couple of real-world examples of trading the Bullish Engulfing Pattern:
Example 1: Stock Trading
Imagine you’re trading Apple Inc. (AAPL) shares. After a significant downtrend, you spot a Bullish Engulfing Pattern on the daily chart. The stock has been declining for several days, and on the last day, the price opened lower but closed significantly higher, engulfing the previous day’s candle.
You enter a long position immediately after the bullish engulfing candle closes, setting your stop-loss below the pattern’s low. You choose a take-profit target based on the nearest resistance level.
As the days pass, the price rises steadily, reaching your target, and you exit the trade with a profit.
Example 2: Forex Trading
Suppose you’re trading the EUR/USD currency pair. On the 4-hour chart, you notice a Bullish Engulfing Pattern after a prolonged downtrend. The price action and volume suggest a potential reversal.
You decide to enter a long position after confirming the pattern with the RSI indicator, which shows the pair is oversold. Your stop-loss is placed just below the engulfing candle, and you aim for a take-profit level based on a fixed reward-to-risk ratio.
The currency pair rises, hitting your target, and you close the trade successfully.
Trading the Bullish Engulfing pattern can be a powerful way to identify potential market reversals and capitalize on them. However, like any trading strategy, it’s crucial to avoid common mistakes that can undermine your success. Here’s a guide to help you steer clear of these pitfalls:
1. Ignoring the Trend Context
Mistake: Trading the Bullish Engulfing pattern without considering the overall market trend.
Why It Matters: The Bullish Engulfing pattern is more reliable when it occurs after a clear downtrend. Trading this pattern in a sideways or uptrend can lead to misleading signals.
Avoidance Tip: Always verify that the Bullish Engulfing pattern appears after a well-defined downtrend. This increases the likelihood that the pattern will signal a genuine reversal.
2. Entering Trades Prematurely
Mistake: Entering a trade based solely on the appearance of the Bullish Engulfing pattern without waiting for confirmation.
Why It Matters: The pattern alone might not always guarantee a reversal. Premature entry can result in losses if the pattern fails to play out as expected.
Avoidance Tip: Wait for the next candle to confirm the pattern. Ideally, enter the trade after the price starts moving in the direction indicated by the pattern, and ensure that other technical indicators align with the signal.
3. Neglecting Risk Management
Mistake: Failing to use proper risk management strategies, such as stop-loss orders, when trading the Bullish Engulfing pattern.
Why It Matters: Without risk management, a single unsuccessful trade can result in significant losses, especially if the market moves against you.
Avoidance Tip: Set a stop-loss order below the low of the engulfed red candle to protect your capital. Determine your risk tolerance and never risk more than you can afford to lose on any single trade.
4. Overlooking Volume
Mistake: Ignoring trading volume when analyzing the Bullish Engulfing pattern.
Why It Matters: Volume can provide additional confirmation of the pattern’s validity. Higher volume during the formation of the green candle suggests stronger buying interest and a more reliable signal.
Avoidance Tip: Look for increased trading volume accompanying the Bullish Engulfing pattern. This confirms that the pattern is supported by significant market activity.
5. Ignoring Other Indicators
Mistake: Relying solely on the Bullish Engulfing pattern without considering other technical indicators or market conditions.
Why It Matters: No single pattern or indicator is foolproof. Relying solely on one pattern can lead to inaccurate predictions and poor trading decisions.
Avoidance Tip: Use additional technical indicators, such as Moving Averages, Relative Strength Index (RSI), or MACD, to confirm the Bullish Engulfing pattern. This helps you make more informed decisions and reduces the risk of false signals.
6. Disregarding Market News
Mistake: Overlooking the impact of current news or economic events on the market.
Why It Matters: News and events can significantly impact market movements and affect the reliability of technical patterns. For example, a major economic announcement or geopolitical event can lead to sudden price movements.
Avoidance Tip: Stay informed about market news and events that could impact your trades. Check economic calendars and news sources to ensure that external factors are not likely to disrupt the pattern’s effectiveness.
7. Overtrading
Mistake: Overtrading based on multiple Bullish Engulfing patterns without proper analysis.
Why It Matters: Overtrading can lead to high transaction costs, increased exposure to market risks, and emotional fatigue.
Avoidance Tip: Be selective and trade only when the Bullish Engulfing pattern aligns with your overall strategy and other confirming indicators. Focus on quality trades rather than quantity.
8. Ignoring Support and Resistance Levels
Mistake: Neglecting to consider support and resistance levels when trading the Bullish Engulfing pattern.
Why It Matters: Support and resistance levels can influence the success of the pattern. A Bullish Engulfing pattern near a strong support level is more likely to lead to a price reversal compared to one in the middle of a downtrend.
Avoidance Tip: Analyze the chart for key support and resistance levels. Ensure that the Bullish Engulfing pattern occurs near a significant support level for a stronger potential reversal signal.
9. Failing to Plan for Exit
Mistake: Not having a clear plan for exiting the trade after entering based on the Bullish Engulfing pattern.
Why It Matters: Without a well-defined exit strategy, you might miss out on profits or hold onto a losing position longer than necessary.
Avoidance Tip: Set clear take-profit targets and consider trailing stops to lock in gains as the price moves in your favor. Have an exit plan in place before entering the trade to guide your decision-making process.
10. Lack of Patience
Mistake: Impatience in waiting for the pattern to fully form and confirm.
Why It Matters: Rushing into trades without allowing the pattern to fully develop can lead to poor decisions and increased risk.
Avoidance Tip: Be patient and wait for the complete formation of the Bullish Engulfing pattern and confirmation from additional indicators. Patience ensures that you only trade when the signal is strong and reliable.
Avoiding these common mistakes can significantly improve your trading success when using the Bullish Engulfing pattern. By ensuring you consider the overall trend, wait for confirmation, use proper risk management, and incorporate additional analysis tools, you enhance your chances of making informed and profitable trades. Remember, successful trading requires a combination of technical skills, market awareness, and disciplined risk management. Stay vigilant, keep learning, and continually refine your strategy for the best results.
A Bullish Engulfing pattern is a popular technical analysis tool used by traders to identify potential reversals in the stock market or other financial markets. It is a chart pattern that signals a change in the current downward trend, suggesting that the price might start going up.
Here’s how it works in simple terms:
- Pattern Formation: The Bullish Engulfing pattern forms when a small red (or bearish) candle, which shows a decline in price, is followed by a larger green (or bullish) candle that completely covers or ‘engulfs’ the previous red candle. The red candle indicates that the market was bearish or falling, while the green candle indicates a shift towards bullish or rising prices.
- Size and Color: The key feature of this pattern is that the green candle must be larger than the red candle and must entirely cover the body of the red candle. The color change from red to green is crucial because it represents a shift from selling pressure to buying pressure.
- Trend Reversal Signal: This pattern often appears at the end of a downtrend and suggests that buyers are gaining control over the market. As a result, traders interpret this as a signal that the price might start increasing.
How to Identify a Bullish Engulfing Pattern
To spot a Bullish Engulfing pattern on a price chart, follow these steps:
- Look for a Downtrend: The pattern is significant when it occurs after a downtrend. The downtrend shows that the price has been falling, and the pattern indicates a potential reversal.
- Identify the Red Candle: The first candle of the pattern is a red (or bearish) candle. This candle shows that the price closed lower than it opened, meaning the market was dominated by sellers.
- Find the Green Candle: The second candle is green (or bullish) and must be larger than the first candle. This green candle should completely cover or ‘engulf’ the red candle. It should open lower than the previous candle’s close and close higher than the previous candle’s open.
- Confirm the Pattern: For the pattern to be confirmed, the second candle must fully cover the body of the first candle. It’s also helpful if the pattern occurs at a significant support level or after a prolonged downtrend.
Example of a Bullish Engulfing Pattern
Imagine a stock price chart where, over the past few days, the stock has been falling. On one day, you see a red candle, indicating that the stock closed lower than it opened. The next day, you observe a green candle that not only opens higher than the previous day’s close but also closes significantly higher than the previous day’s open.
This green candle has completely covered the red candle from the previous day. This situation signals a potential reversal of the downtrend and suggests that it might be a good time to consider buying the stock.
How to Trade the Bullish Engulfing Pattern
Trading based on the Bullish Engulfing pattern involves several steps to ensure that you are making informed decisions. Here’s a simple guide on how to trade this pattern:
- Confirm the Pattern: Before making any trades, ensure that the pattern meets all the criteria. The green candle should completely engulf the red candle, and the pattern should appear after a clear downtrend. It’s also helpful to use additional indicators or tools to confirm the pattern, such as support and resistance levels or technical indicators like moving averages.
- Entry Point: Once you’ve confirmed the Bullish Engulfing pattern, you may consider entering a trade. Typically, traders enter a buy order at the open of the next candle after the Bullish Engulfing pattern is complete. This means you place a buy order at the start of the next trading session or when the pattern confirms in the next candle.
- Stop-Loss Order: To manage risk, set a stop-loss order below the low of the red candle. This way, if the price moves against you, your losses will be limited. The stop-loss level is crucial because it helps you protect your capital in case the pattern does not lead to the expected reversal.
- Take Profit: Decide on a target price where you will take profits. This target could be based on previous resistance levels, a specific percentage gain, or other technical analysis methods. It’s important to have a plan for taking profits to lock in gains and avoid giving back profits if the price reverses.
- Monitor the Trade: Keep an eye on the trade and be prepared to adjust your strategy if market conditions change. Sometimes, additional signals or changes in market trends might require you to reassess your trade.
- Use Additional Tools: Combine the Bullish Engulfing pattern with other technical indicators for better accuracy. Indicators like Relative Strength Index (RSI), Moving Average Convergence Divergence (MACD), or trend lines can provide additional confirmation and help you make more informed decisions.
Tips for Successful Trading with Bullish Engulfing Patterns
- Practice Patience: Not every Bullish Engulfing pattern leads to a successful trade. It’s important to wait for confirmation and avoid jumping into trades based solely on pattern recognition.
- Understand Market Context: Always consider the broader market context. The pattern is more effective when it occurs in a well-defined downtrend and near significant support levels.
- Manage Your Risk: Use proper risk management techniques, including setting stop-loss orders and limiting the size of your trades. Never risk more than you can afford to lose.
- Stay Informed: Keep up with market news and developments that could impact your trades. Economic events, earnings reports, and other news can influence market trends and affect the reliability of technical patterns.
- Practice on a Demo Account: If you are new to trading or using the Bullish Engulfing pattern, consider practicing on a demo account before committing real money. This helps you get familiar with the pattern and develop your trading strategy without financial risk.
Conclusion
The Bullish Engulfing pattern is a valuable tool for traders looking to identify potential reversals in a downtrend. By understanding how to recognize this pattern and how to trade it effectively, you can make more informed trading decisions and improve your chances of success in the financial markets. Remember to combine pattern recognition with proper risk management and additional technical analysis tools for the best results. Happy trading!