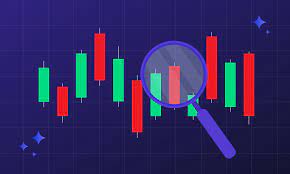
Candlestick Charts-A Beginner’s Guide

Understanding Candlestick Charts: A Beginner’s Guide
For beginners entering the world of financial markets, understanding the different charting tools used in trading is essential. One popular chart type used by traders to analyze price movements is the candlestick chart. This comprehensive guide aims to simplify the concept of candlestick charts and provide beginners with the necessary knowledge to interpret and utilize them effectively.
1. What is a Candlestick Chart?
1.1 Definition of Candlestick Chart
- A candlestick chart is a type of financial chart used to display the price movements of an asset over a specific period.
- It provides visual information about the opening, closing, high, and low prices within a given timeframe.
1.2 Origins of Candlestick Charts
- The origin of candlestick charts dates back to the 18th century in Japan, where they were used to analyze the price of rice.
- The chart’s appearance resembles candlesticks, which is how it acquired its name.
2. Anatomy of a Candlestick
2.1 Candlestick Components
- The body: Represents the price range between the opening and closing prices.
- The wicks or shadows: Indicate the highest and lowest prices reached during the selected timeframe.
2.2 Understanding Bullish and Bearish Candles
- Bullish candle: The closing price is higher than the opening price, indicating a price increase.
- Bearish candle: The closing price is lower than the opening price, suggesting a price decrease.
3. Interpreting Candlestick Patterns
3.1 Single Candlestick Patterns
- Doji: Occurs when the opening and closing prices are almost equal, indicating indecision in the market.
- Hammer and Hanging Man: Signal potential trend reversals based on their appearance after a downtrend or uptrend.
3.2 Multiple Candlestick Patterns
- Engulfing Pattern: A reversal pattern where one candle “engulfs” the previous one, signaling a potential change in trend.
- Morning Star and Evening Star: A bullish and bearish pattern, respectively, signaling possible trend reversals.
4. Timeframes and Candlestick Chart Interpretation
4.1 Selecting Timeframes
- Different timeframes, such as minutes, hours, days, or weeks, show varying levels of detail in price movements.
- Short-term traders often use smaller timeframes, while long-term investors prefer larger ones.
4.2 Identifying Trend and Support/Resistance Levels
- Use candlestick charts to identify the overall trend of an asset.
- Spot support and resistance levels based on areas where price action has historically stalled or reversed.
5. Using Candlestick Charts in Trading
5.1 Entry and Exit Strategies
- Combine candlestick patterns with other technical indicators to identify potential entry and exit points.
- Confirm signals from candlestick patterns with trendlines, moving averages, or oscillators.
5.2 Risk Management and Stop-Loss Placement
- Implement proper risk management techniques to protect your trading capital.
- Set stop-loss orders below support levels for long positions and above resistance levels for short positions.
6. Common Mistakes to Avoid
6.1 Overlooking Market Context
- Consider the broader market context and fundamental factors in addition to candlestick patterns.
- Avoid making trading decisions based solely on one candlestick pattern.
6.2 Ignoring Confirmation Signals
- Look for confirmation from other technical indicators to strengthen the validity of candlestick patterns.
- Relying solely on candlestick patterns can lead to false signals.
7. Continuous Learning and Practice
7.1 Expand Your Knowledge
- Study different candlestick patterns and their meanings.
- Continue learning about technical analysis and trading strategies.
7.2 Practice with Demo Accounts
- Use demo trading accounts to practice interpreting candlestick charts and executing trades without risking real money.
- Gain confidence and experience before trading with real funds.
Conclusion
Candlestick charts are a valuable tool for beginners to analyze price movements and make informed trading decisions. By understanding the anatomy of candlesticks, interpreting various candlestick patterns, and using them in combination with other technical indicators, beginners can gain a deeper insight into market trends and potential entry and exit points. Remember to practice and continuously learn to enhance your skills in using candlestick charts effectively. With dedication and patience, you can become a more proficient trader and make better-informed decisions in the dynamic world of financial markets.