How Do I Identify a Pinbar?
Simple Explanation:
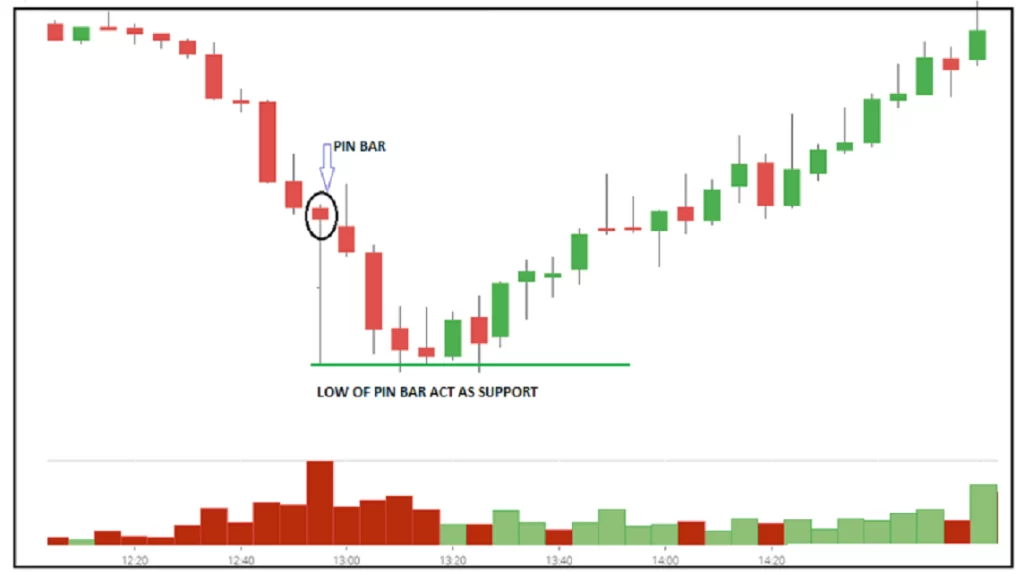
To identify a pinbar candle, look for the following features:
- Long Wick: The wick should be at least twice the size of the candle’s body. The wick’s length shows that the price was pushed in one direction but ultimately rejected it.
- Small Body: The body should be small and located at one end of the candle. This means the open and close are close together, either at the top or bottom of the candle.
- Direction: The long wick should be pointing against the current trend. In a downtrend, look for a long lower wick; in an uptrend, a long upper wick.
Motivational Story:
Imagine the journey of J.K. Rowling, who faced rejection after rejection before finally getting her “Harry Potter” books published. Her persistence and eventual triumph mirror the story told by a pinbar: initial setbacks often lead to eventual success.
Example: During the Bitcoin bull market in 2017, traders noticed pinbar formations that indicated temporary pullbacks. Recognizing these patterns allowed them to enter at more favorable prices and maximize profits.
Motivational Quote:
“Success is not how high you have climbed, but how you make a positive difference to the world.” – Roy T. Bennett
This quote highlights how identifying the right opportunities, like spotting a pinbar, can lead to significant gains.
Identifying a pinbar involves recognizing its distinct long wick and small body. This pattern is a powerful indicator of potential reversals and offers traders a chance to act on market sentiment shifts.
What is a Characteristic of a Bullish Pinbar Candle?
Simple Explanation:
A bullish pinbar candle is a candlestick pattern that suggests a potential upward reversal in price. Here are its main characteristics:
- Long Lower Wick: The long lower wick shows that sellers pushed the price down, but buyers regained control, pushing it back up.
- Small Upper Body: The small body is at the top of the candle, indicating that the closing price was higher than the opening price.
- Close Above Open: The candle closes above its opening price, reinforcing the bullish sentiment.
Motivational Story:
The story of Oprah Winfrey’s rise from poverty to becoming one of the most influential media moguls is akin to a bullish pinbar. Her resilience and ability to overcome adversity exemplify how setbacks can lead to breakthroughs.
Example: In 2019, the stock of Tesla frequently showed bullish pinbars during its climb, indicating moments where investors regained confidence despite temporary sell-offs.
Motivational Quote:
“The best way to predict the future is to create it.” – Peter Drucker
This quote underscores the proactive nature of spotting bullish pinbars, allowing traders to anticipate and capitalize on positive market movements.
A bullish pinbar candle is a clear sign of buyer strength, showcasing how markets can shift from bearish to bullish sentiment. Recognizing this pattern enables traders to make well-informed decisions in anticipation of price rises.
What is the Difference Between a Pinbar and a Doji Candle?
Simple Explanation:
A pinbar and a doji candle are both candlestick patterns used in technical analysis, but they differ in appearance and meaning:
- Pinbar:
- Long Wick: Has a long wick, indicating a strong rejection of a price level.
- Small Body: The body is small and located at one end, suggesting a potential reversal.
- Directional Indication: Often signals a reversal in the direction of the wick.
- Doji Candle:
- Equal Open and Close: The open and close prices are nearly the same, creating a cross-like shape.
- Indecision: Represents market indecision, with buyers and sellers at a stalemate.
- Neutral Signal: It can indicate a reversal or continuation depending on the context.
Motivational Story:
The story of Nelson Mandela’s journey to becoming South Africa’s president after years of imprisonment can be likened to a doji: a period of uncertainty that eventually led to significant change. Meanwhile, the pinbar represents decisive action and change.
Example: In Forex trading, pinbars are often used to signal entry points, while dojis are watched for potential market indecision and volatility, guiding traders to stay cautious or look for confirmation.
Motivational Quote:
“Change is the law of life. And those who look only to the past or present are certain to miss the future.” – John F. Kennedy
This quote highlights the need to adapt and recognize shifts in market sentiment, as shown by both pinbars and dojis.
While both pinbar and doji candles provide insights into market behavior, the pinbar offers a clearer indication of potential reversals, whereas the doji often signals indecision. Understanding these differences helps traders make informed decisions in various market scenarios.
What is the Difference Between a Candle and a Bar?
Simple Explanation:
Candlestick and bar charts are both methods of displaying price movements, but they have distinct visual representations and information:
- Candlestick Chart:
- Visual Appeal: Shows price movements with a body and wicks, providing a clear view of open, close, high, and low prices.
- Body and Wicks: The body represents the open and close, while the wicks indicate the high and low.
- Color Coding: Uses colors to show whether the price closed higher or lower (e.g., green for up, red for down).
- Bar Chart:
- Simple Lines: Uses a vertical line to show the high and low, with horizontal lines on the left and right indicating open and close.
- Less Intuitive: Requires more analysis to interpret price action compared to candlestick charts.
- Detail-Oriented: Focuses more on price levels without the visual cues of color-coded bodies.
Motivational Story:
The story of Albert Einstein’s dedication to scientific exploration can be seen in the choice between candlestick and bar charts. While candlesticks offer quick insights, bar charts require a deeper understanding and analysis, akin to how Einstein approached his groundbreaking work.
Example: Traders often use candlestick charts for a quick visual assessment, while some prefer bar charts for detailed historical analysis.
Motivational Quote:
“The only way to do great work is to love what you do.” – Steve Jobs
This quote suggests that whether you use candlestick or bar charts, understanding their nuances and mastering them can lead to successful trading.
Candlestick charts provide a visually intuitive way to understand market movements, while bar charts offer detailed information for analytical traders. Knowing the differences and choosing the right tool based on your trading style can enhance decision-making and effectiveness.
What is Inside a Bar Candle?
Simple Explanation:
A bar candle, or simply a bar, is a representation of price movements during a specific period. It consists of several components that give traders insights into market behavior:
- Vertical Line: Shows the highest and lowest prices during the trading period.
- Left Horizontal Line: Indicates the opening price.
- Right Horizontal Line: Indicates the closing price.
- Body Absence: Unlike candlesticks, bar charts do not have a body, which means no visual distinction between open and close, relying on lines for detail.
Motivational Story:
The story of Mahatma Gandhi’s transformative influence on India through non-violence reflects the simple yet profound impact of understanding a bar candle. It may seem straightforward, but its depth lies in the details, just as Gandhi’s philosophy did.
Example: Professional traders often use bar charts to focus on price levels without distractions, allowing them to pinpoint critical support and resistance levels.
Motivational Quote:
“Simplicity is the ultimate sophistication.” – Leonardo da Vinci
This quote captures the essence of bar candles, where simplicity allows for a sophisticated understanding of market dynamics.
Inside a bar candle lies valuable information about the market’s highs, lows, opens, and closes. By mastering the details, traders can gain crucial insights into price action and make well-informed decisions.