How to Look for a Downtrends

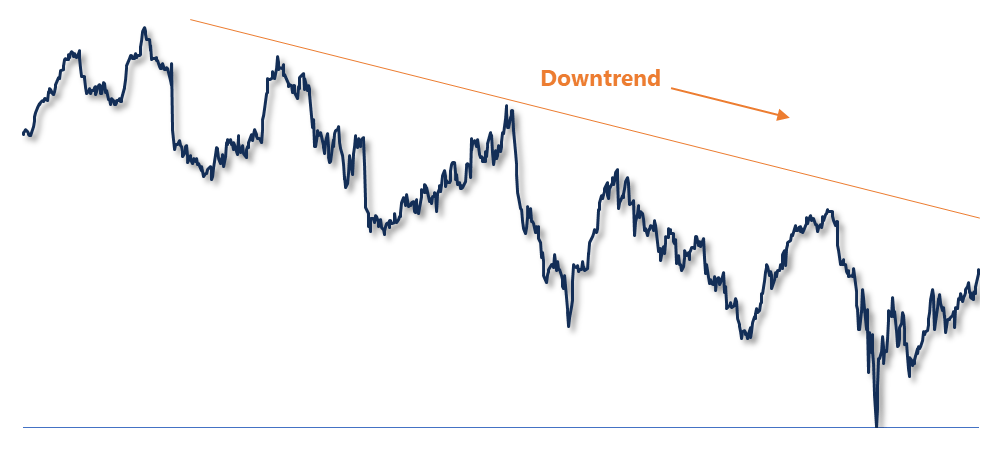
A downtrend is a pattern in the market where the price of an asset consistently decreases over time. It is characterized by a series of lower highs and lower lows, indicating that sellers are in control and prices are falling. Traders often use technical analysis tools like moving averages and trendlines to identify downtrends. In a downtrend, the price typically stays below key moving averages, and trading volume may increase during price declines. Recognizing a downtrend is important for traders and investors because it can help them decide when to sell or avoid buying an asset. Overall, understanding downtrends can lead to more informed and strategic trading decisions.
Looking for a downtrend in the stock market or any financial market is an essential skill for traders and investors. A downtrend occurs when the price of an asset consistently moves lower over a period of time. Here’s how you can spot a downtrend in simple terms:
- Lower Highs and Lower Lows: In a downtrend, the price forms a series of lower highs and lower lows. This means that each peak (high) and each bottom (low) is lower than the previous one.
- Moving Averages: Use moving averages, such as the 50-day or 200-day moving average, to identify trends. If the price is consistently below these averages and the averages are sloping downward, it indicates a downtrend.
- Trendlines: Draw a straight line connecting the highs of a price chart. If this line is sloping downwards, it suggests a downtrend.
- Volume Increase: Pay attention to trading volume. In a downtrend, you might see higher volume on down days compared to up days, indicating stronger selling pressure.
- Bearish Candlestick Patterns: Look for candlestick patterns like the bearish engulfing or shooting star, which can signal a potential continuation of a downtrend.
By identifying these signals, you can better understand market trends and make informed trading decisions.
Why Do Most Traders Use the Bullish Engulfing Pattern? Read More>>>