Keltner Channel
Keltner Channel Explained: A Guide for Traders
The Keltner Channel is a popular technical analysis tool used by traders to help identify trends, potential breakout points, and overbought or oversold conditions in the market. Named after Chester W. Keltner, who introduced it in the 1960s, the Keltner Channel provides a visual representation of price volatility and market trends. In this guide, we’ll explore what the Keltner Channel is, how it’s calculated, and how traders use it in their strategies.
What is the Keltner Channel?
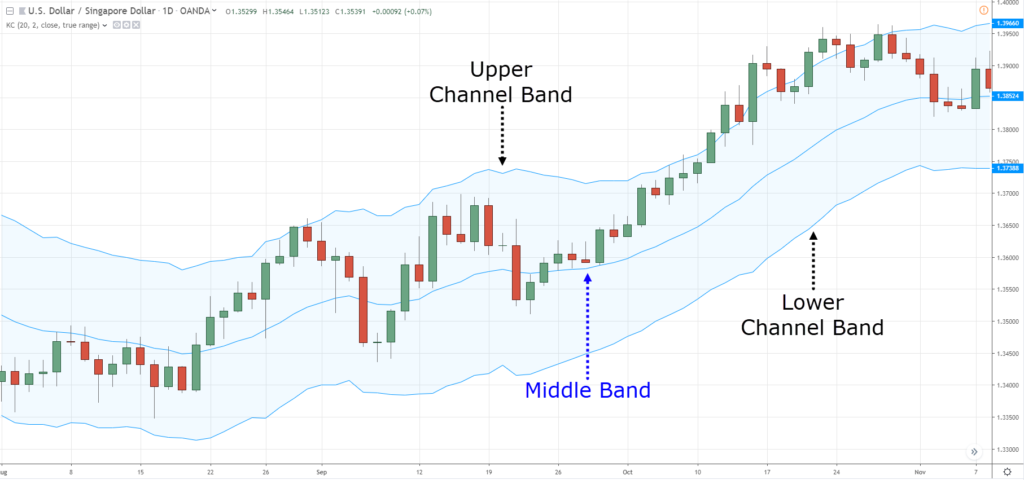
The Keltner Channel is an indicator that consists of three lines plotted on a price chart:
- Middle Line (EMA): This is a moving average of the price, typically the Exponential Moving Average (EMA).
- Upper Channel Line: This is the EMA plus a multiple of the Average True Range (ATR).
- Lower Channel Line: This is the EMA minus a multiple of the ATR.
The space between the upper and lower lines creates a “channel” around the price. The channel width is determined by the ATR, which measures volatility. This setup helps traders identify whether the market is trending and provides signals for potential entry and exit points.
Calculation of Keltner Channel
The Keltner Channel is constructed using the following steps:
- Calculate the Exponential Moving Average (EMA):
- The EMA is usually calculated over a 20-day period, but traders may adjust this to suit their trading style.
- EMA = [Price(t) * (2 / (n + 1))] + [EMA(y) * (1 – (2 / (n + 1)))]
- Where:
- Price(t) is the closing price at time t
- EMA(y) is the previous period’s EMA
- n is the number of periods
- Calculate the Average True Range (ATR):
- The ATR is typically calculated over a 10 or 20-day period.
- ATR = (High(t) – Low(t), |High(t) – Close(t-1)|, |Low(t) – Close(t-1)|)
- Take the average of these true ranges over the specified period.
- Calculate the Upper and Lower Channels:
- Upper Channel Line = EMA + (Multiplier * ATR)
- Lower Channel Line = EMA – (Multiplier * ATR)
- The Multiplier is often set to 2, but it can be adjusted based on the trader’s preference for sensitivity.
Interpreting the Keltner Channel
The Keltner Channel provides several key insights for traders:
- Trend Identification:
- Uptrend: When the price consistently closes above the middle EMA line, it indicates a strong uptrend. The upper channel line can act as resistance.
- Downtrend: When the price closes below the middle line, it signals a downtrend. The lower channel line can serve as support.
- Breakout Signals:
- A breakout above the upper channel line can suggest a bullish trend continuation or reversal, indicating a potential buying opportunity.
- A breakout below the lower channel line might indicate a bearish trend continuation or reversal, suggesting a selling opportunity.
- Overbought and Oversold Conditions:
- If the price is near the upper channel line, the market might be overbought, leading to potential selling opportunities.
- If the price is near the lower channel line, it might be oversold, leading to potential buying opportunities.
- Volatility Analysis:
- A widening channel indicates increased volatility, while a narrowing channel suggests decreased volatility.
Example of Keltner Channel Usage
Let’s consider an example using a stock chart with a 20-day EMA and a 10-day ATR:
- EMA Calculation:
- Assume a 20-day EMA is at $50.
- ATR Calculation:
- Assume a 10-day ATR is $2.
- Upper and Lower Channels:
- Upper Channel = EMA + (2 * ATR) = $50 + (2 * $2) = $54
- Lower Channel = EMA – (2 * ATR) = $50 – (2 * $2) = $46
In this scenario, the price consistently closing above $54 might suggest a strong uptrend. Conversely, if the price drops below $46, it might indicate a downtrend or a potential reversal.
Keltner Channel vs. Bollinger Bands
While both the Keltner Channel and Bollinger Bands are used for trend and volatility analysis, they have differences in calculation and interpretation:
- Bollinger Bands use the Standard Deviation to calculate the channel width, making them more sensitive to sudden price changes. They adjust dynamically based on market conditions.
- Keltner Channel relies on the ATR, which provides a smoother and more stable representation of volatility. It tends to be less reactive to short-term price spikes.
Benefits of Using the Keltner Channel
- Easy to Interpret: The Keltner Channel provides a straightforward visualization of market trends and volatility.
- Flexibility: Traders can adjust the EMA period and ATR multiplier to suit their trading style and market conditions.
- Reliable Trend Signals: The indicator is effective in identifying trend directions and potential reversal points.
Drawbacks of the Keltner Channel
- Lagging Indicator: Like most moving averages, the Keltner Channel is a lagging indicator and may not capture the latest price changes immediately.
- False Signals: In highly volatile markets, the channel may produce false breakout signals.
- Limited Use in Sideways Markets: The Keltner Channel may not be as effective in ranging or sideways markets.
Conclusion
The Keltner Channel is a versatile tool that helps traders analyze market trends and volatility. By providing a clear visual representation of price movements, it aids in making informed trading decisions. Whether you’re a beginner or an experienced trader, understanding the Keltner Channel can enhance your trading strategy and improve your market analysis. Always consider combining it with other indicators and trading strategies to confirm signals and manage risks effectively.