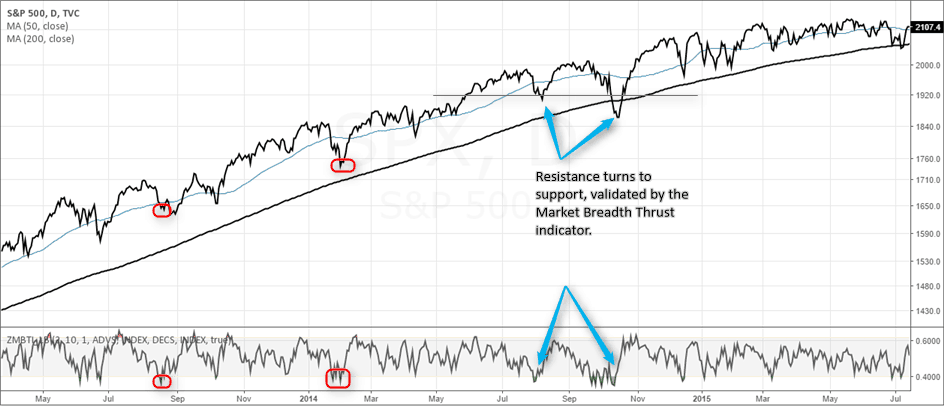
Market Thrust Indicator

Understanding the Market Thrust Indicator:
The Market Thrust Indicator is a powerful tool used by traders and analysts to gauge the overall momentum and strength of a stock market or an individual security. It is designed to provide insights into the underlying market dynamics by considering both advancing and declining stocks, allowing investors to make informed decisions about potential market trends.
What is the Market Thrust Indicator?
The Market Thrust Indicator is a type of breadth indicator that measures market momentum by analyzing the number of advancing stocks versus declining stocks. It combines this data with volume to provide a comprehensive view of the market’s strength. Unlike other indicators that focus solely on price movements, the Market Thrust Indicator considers the broader market context, making it a valuable tool for identifying bullish or bearish trends.
Components of the Market Thrust Indicator
- Advancing Stocks: These are stocks that have increased in price over a given period. The number of advancing stocks indicates market optimism and strength.
- Declining Stocks: These are stocks that have decreased in price. A high number of declining stocks suggests market pessimism and weakness.
- Volume: The Market Thrust Indicator incorporates trading volume to assess the intensity of buying or selling pressure. Higher volumes often indicate stronger market conviction.
- Breadth Ratio: The breadth ratio is calculated by dividing the number of advancing stocks by the number of declining stocks. A ratio above 1 indicates more advancing stocks, while a ratio below 1 suggests more declining stocks.
- Thrust Index: The thrust index is calculated by multiplying the breadth ratio by the total volume of advancing stocks and dividing it by the total volume of declining stocks. This gives a numerical value that represents market momentum.
How Does the Market Thrust Indicator Work?
The Market Thrust Indicator works by analyzing the balance between advancing and declining stocks and the associated trading volumes. Here’s how it’s typically used:
- Bullish Signal: When the Market Thrust Indicator shows a high thrust index, it indicates strong buying pressure and market momentum. This is often seen as a bullish signal, suggesting that the market is likely to continue rising.
- Bearish Signal: Conversely, a low thrust index indicates strong selling pressure and weakening market momentum. This is considered a bearish signal, suggesting that the market may be entering a downtrend.
- Divergence: Traders often look for divergences between the Market Thrust Indicator and the market index. For example, if the market index is rising, but the thrust index is falling, it may indicate underlying weakness and a potential reversal.
Practical Application
The Market Thrust Indicator is particularly useful for short-term traders and market analysts who want to capture quick market movements. It provides an additional layer of analysis beyond price movements, helping traders identify potential entry and exit points. By combining the thrust index with other technical indicators, such as moving averages or RSI (Relative Strength Index), traders can improve their decision-making process.
Limitations
While the Market Thrust Indicator is a valuable tool, it is not without limitations. It can sometimes produce false signals, especially in volatile markets where sudden changes in sentiment can skew the indicator. Additionally, the indicator’s effectiveness may vary across different market conditions and asset classes.
The Market Thrust Indicator is a comprehensive tool that provides valuable insights into market momentum and breadth. By analyzing the balance between advancing and declining stocks and incorporating trading volume, it offers traders a nuanced view of market dynamics. However, like all technical indicators, it should be used in conjunction with other analysis tools and strategies to ensure accurate decision-making.