McClellan Oscillator
The McClellan Oscillator is a popular technical analysis tool used by traders and investors to understand stock market trends. Developed by Sherman and Marian McClellan in the late 1960s, it helps identify the strength or weakness of the stock market by analyzing the difference between the number of advancing and declining stocks on a particular exchange, usually the New York Stock Exchange (NYSE). This indicator gives insights into the market's momentum and helps traders make informed decisions.
The McClellan Oscillator is a popular technical analysis tool used by traders and investors to understand stock market trends. Developed by Sherman and Marian McClellan in the late 1960s, it helps identify the strength or weakness of the stock market by analyzing the difference between the number of advancing and declining stocks on a particular exchange, usually the New York Stock Exchange (NYSE). This indicator gives insights into the market’s momentum and helps traders make informed decisions.
In this guide, we’ll break down the McClellan Oscillator into simple, easy-to-understand terms, including how it’s calculated, interpreted, and used in trading.
What is the McClellan Oscillator?
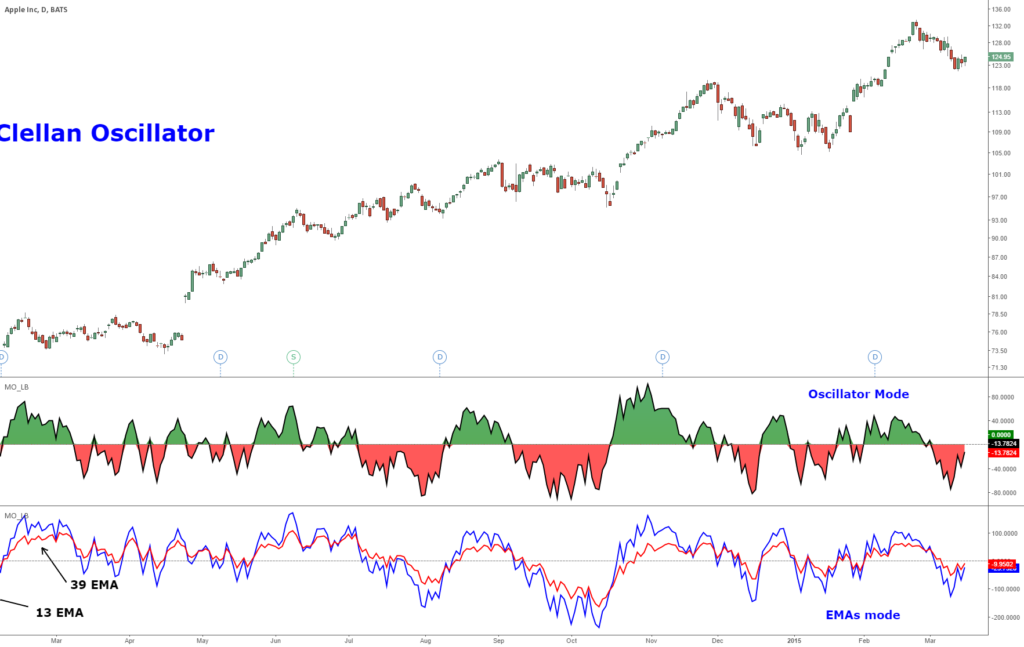
The McClellan Oscillator is a momentum indicator that calculates the difference between two exponential moving averages (EMAs) of the number of advancing and declining stocks. It’s essentially a breadth indicator, meaning it measures the market’s overall health rather than focusing on individual stocks.
- Advancing Stocks: Stocks that close higher than their previous closing price.
- Declining Stocks: Stocks that close lower than their previous closing price.
Why is it Important?
Understanding the McClellan Oscillator can help traders gauge whether the stock market is overbought or oversold, indicating potential reversal points. It helps determine the market’s direction and strength, which is essential for making buy or sell decisions.
How is it Calculated?
The McClellan Oscillator is calculated using the difference between two moving averages of the net advances (advancing issues minus declining issues):
- Calculate Net Advances:Net Advances=Advancing Stocks−Declining Stocks\text{Net Advances} = \text{Advancing Stocks} – \text{Declining Stocks}Net Advances=Advancing Stocks−Declining Stocks
- Calculate Two EMAs:
- Short-term EMA (19-day): This gives more weight to recent data and reacts quickly to changes in the market.
- Long-term EMA (39-day): This reacts slower and smooths out short-term fluctuations.
- Subtract the Long-term EMA from the Short-term EMA:McClellan Oscillator=EMA19−EMA39\text{McClellan Oscillator} = \text{EMA}_{19} – \text{EMA}_{39}McClellan Oscillator=EMA19−EMA39
The McClellan Oscillator’s value oscillates around a zero line, providing a visual representation of market momentum.
How to Interpret the McClellan Oscillator
The McClellan Oscillator can be interpreted in several ways:
- Zero Line Crossovers:
- Above Zero: When the oscillator is above zero, it indicates that more stocks are advancing than declining, suggesting a bullish market.
- Below Zero: When the oscillator is below zero, it indicates that more stocks are declining than advancing, suggesting a bearish market.
- Overbought/Oversold Conditions:
- Overbought: If the oscillator reaches a high positive value (e.g., +100 or more), the market might be overbought, meaning stocks have risen too quickly and might be due for a pullback.
- Oversold: If the oscillator reaches a low negative value (e.g., -100 or less), the market might be oversold, meaning stocks have fallen too quickly and might be due for a bounce back.
- Divergence:
- Bullish Divergence: Occurs when the market index is making new lows, but the oscillator is making higher lows. This suggests that the downward momentum is weakening and could indicate a potential upward reversal.
- Bearish Divergence: Occurs when the market index is making new highs, but the oscillator is making lower highs. This suggests that the upward momentum is weakening and could indicate a potential downward reversal.
Example of the McClellan Oscillator Calculation
Let’s assume we have the following data for a specific trading day:
- Advancing Stocks: 1800
- Declining Stocks: 1200

Interpreting the Result
With the McClellan Oscillator at 52.5, it indicates a positive market momentum, suggesting more stocks are advancing than declining. Since the value is above zero but not excessively high, it implies a bullish trend with moderate strength.
How Traders Use the McClellan Oscillator
Traders use the McClellan Oscillator in various ways to make informed decisions:
- Identifying Trends:
- When the oscillator consistently stays above zero, it confirms a bullish trend, encouraging traders to look for buying opportunities.
- When the oscillator consistently stays below zero, it confirms a bearish trend, encouraging traders to look for selling opportunities.
- Spotting Reversals:
- Overbought or oversold readings can signal potential reversals. Traders often wait for the oscillator to cross back below or above these extreme levels before taking action.
- Divergence Signals:
- Divergence between the market index and the oscillator can indicate potential trend reversals. Traders may use this as a cue to adjust their positions or enter new trades.
Limitations of the McClellan Oscillator
While the McClellan Oscillator is a valuable tool, it does have limitations:
- Lagging Indicator: Since it uses moving averages, it may lag behind current market conditions, potentially providing late signals.
- False Signals: Like any technical indicator, it can produce false signals, leading to incorrect trading decisions.
- Market Conditions: It may be less effective in highly volatile or sideways markets, where trends are not clearly defined.
Conclusion
The McClellan Oscillator is a powerful tool for analyzing market breadth and momentum. By understanding the difference between advancing and declining stocks, traders can gain valuable insights into the market’s health and potential direction. While it’s not without limitations, when used alongside other technical indicators and analysis methods, it can be an essential part of a trader’s toolkit.
Summary
- Purpose: Measures market breadth and momentum.
- Calculation: Difference between 19-day and 39-day EMAs of net advances.
- Interpretation: Zero line crossovers, overbought/oversold conditions, divergence signals.
- Usage: Identifying trends, spotting reversals, divergence analysis.
- Limitations: Lagging indicator, potential for false signals, less effective in volatile markets.
By mastering the McClellan Oscillator, traders can enhance their market analysis skills and make more informed trading decisions.