Understanding Moving Averages: A Simple Guide
Moving averages are one of the most popular tools used in technical analysis to identify trends in financial markets. They help traders and investors smooth out price data, making it easier to see the direction of a trend over a period of time. Whether you’re new to trading or a seasoned investor, understanding how moving averages work can provide valuable insights into market behavior.
What Are Moving Averages?
A moving average (MA) is a statistical calculation used to analyze data points by creating a series of averages of different subsets of the full data set. In the context of financial markets, moving averages are used to observe the price trend of a stock, commodity, index, or currency pair. By averaging out the price data, moving averages help reduce the noise created by daily fluctuations and provide a clearer view of the overall direction.
There are several types of moving averages, but the most commonly used are the Simple Moving Average (SMA) and the Exponential Moving Average (EMA).
Types of Moving Averages
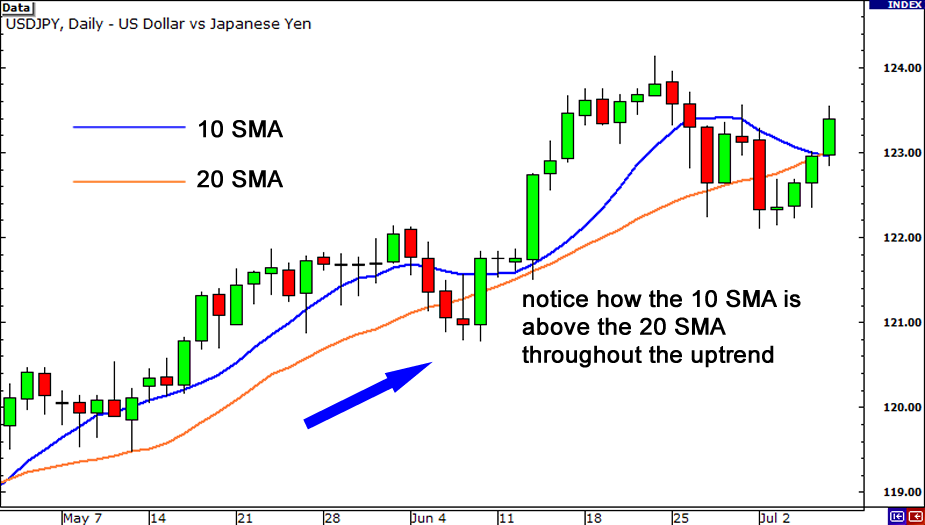
- Simple Moving Average (SMA):The Simple Moving Average is calculated by taking the arithmetic mean of a set number of closing prices over a specific period. For example, a 10-day SMA adds up the closing prices of the last 10 days and divides the total by 10.
- Exponential Moving Average (EMA):The Exponential Moving Average gives more weight to recent prices, making it more sensitive to new information. It reacts more quickly to price changes compared to the SMA.
- Weighted Moving Average (WMA):The Weighted Moving Average assigns different weights to each data point, typically giving more importance to recent prices. The formula involves multiplying each price by a predetermined weight and summing the results.gular Moving Average is an average of the Simple Moving Average and is calculated over a period to create an even smoother line.
How to Use Moving Averages
Moving averages can be used in a variety of ways to enhance trading strategies. Here are some of the most common applications:
- Identifying Trends:
- Bullish Trend: If the moving average is trending upwards, it indicates a bullish market, where prices are generally increasing.
- Bearish Trend: If the moving average is trending downwards, it signifies a bearish market, where prices are generally decreasing.
- Crossovers:A crossover occurs when two moving averages of different periods intersect. There are two main types of crossovers:
- Golden Cross: This bullish signal happens when a short-term moving average crosses above a long-term moving average. For example, when the 50-day SMA crosses above the 200-day SMA, it indicates potential upward momentum.
- Death Cross: This bearish signal occurs when a short-term moving average crosses below a long-term moving average. It suggests potential downward momentum.
- Support and Resistance Levels:Moving averages can act as dynamic support or resistance levels. During an uptrend, the moving average may serve as a support level, where the price tends to bounce higher. Conversely, during a downtrend, it may act as a resistance level, where the price is likely to decline.Traders often watch for price interactions with moving averages to confirm potential reversals or continuations of a trend.
- Moving Average Envelope:Moving average envelopes are created by placing two lines above and below a moving average, representing a fixed percentage distance. This technique helps traders identify overbought or oversold conditions.When the price moves outside the envelope, it may signal a potential reversal or continuation of the trend.
Choosing the Right Moving Average
Choosing the right moving average depends on various factors, including the asset being analyzed, the trader’s strategy, and the market conditions. Here are some general guidelines:
- Short-term Trading: Use shorter periods like 5-day or 10-day moving averages for faster reactions to price changes.
- Medium-term Trading: Opt for medium-term periods like 20-day or 50-day moving averages to capture trends without excessive noise.
- Long-term Investing: Use longer periods like 100-day or 200-day moving averages to focus on broader trends and reduce short-term fluctuations.
Traders may experiment with different moving average combinations to find what works best for their specific trading style.
Advantages and Limitations
Advantages:
- Simplicity: Moving averages are easy to understand and apply in various market conditions.
- Trend Identification: They help identify trends and confirm potential reversals.
- Flexibility: Different types and periods of moving averages allow customization to fit trading strategies.
Limitations:
- Lagging Indicator: Moving averages are based on historical data, causing them to lag behind current market conditions.
- Whipsaw Signals: In choppy markets, moving averages may produce false signals due to frequent crossovers.
- Subjectivity: Choosing the right type and period of moving average requires judgment, and different traders may interpret them differently.
Conclusion
Moving averages are a fundamental tool in technical analysis, offering valuable insights into market trends and potential trading opportunities. By smoothing out price data, they provide a clearer picture of the market’s direction and help traders make informed decisions. While moving averages have their limitations, when used correctly in conjunction with other analysis techniques, they can be a powerful addition to any trading strategy. Whether you’re a short-term trader or a long-term investor, understanding and effectively using moving averages can enhance your ability to navigate the financial markets.