Triangular Moving Average
Understanding the Triangular Moving Average: A Comprehensive Guide
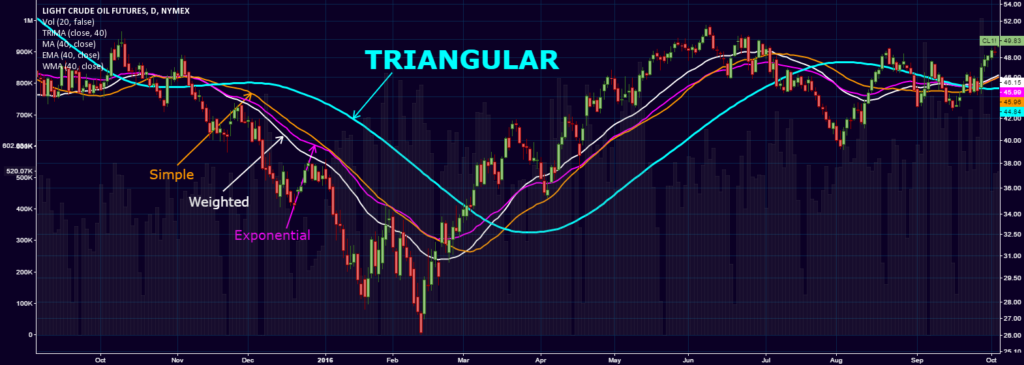
The Triangular Moving Average (TMA) is a variation of the Simple Moving Average (SMA) used by traders to create a smoother representation of price data. By averaging the SMA itself, the TMA provides a more refined view of market trends, helping traders reduce noise and make better-informed decisions. This guide explains what the TMA is, how it works, and its advantages and disadvantages in trading.
What is the Triangular Moving Average (TMA)?
The Triangular Moving Average is a type of moving average that involves a double smoothing process. Essentially, it calculates the Simple Moving Average twice, which results in a smoother line. This technique is particularly useful for identifying long-term trends by minimizing short-term fluctuations in price data.
Here’s how it works:
- First Smoothing: Calculate the Simple Moving Average (SMA) for a specific period.
- Second Smoothing: Take the average of the previously calculated SMA values.
This double averaging process gives the TMA its characteristic smoothness, making it less sensitive to sudden price changes and providing a clearer view of the overall trend.
How is the TMA Calculated?
To calculate the TMA, follow these steps:
- Calculate the Simple Moving Average (SMA):
- Select a specific number of periods (e.g., 10 days).
- Add the closing prices for these periods.
- Divide by the number of periods to get the average.
- Calculate the Second SMA:
- Apply the SMA calculation again using the SMA values obtained in the first step.
- This results in a smoother average, which is the TMA.
For example, if you’re using a 10-day period, you would first calculate the 10-day SMA and then use these values to calculate the TMA.
Example of TMA Calculation
Suppose you have the following closing prices for a stock over 5 days:
- Day 1: $100
- Day 2: $102
- Day 3: $104
- Day 4: $101
- Day 5: $103
Step 1: Calculate the 3-day SMA:
- SMA for Day 3 = (100 + 102 + 104) / 3 = 102
- SMA for Day 4 = (102 + 104 + 101) / 3 = 102.33
- SMA for Day 5 = (104 + 101 + 103) / 3 = 102.67
Step 2: Calculate the TMA:
- TMA = (SMA for Day 3 + SMA for Day 4 + SMA for Day 5) / 3
- TMA = (102 + 102.33 + 102.67) / 3 = 102.33
The TMA provides a smoother average compared to the SMA alone, helping to filter out market noise.
Benefits of Using the TMA
- Smoothness: The TMA is less reactive to short-term fluctuations, making it ideal for identifying longer-term trends.
- Noise Reduction: By averaging twice, it reduces market noise, which can help traders focus on significant price movements.
- Trend Analysis: The TMA is useful for analyzing trends in both trending and range-bound markets.
Drawbacks of the TMA
- Lag: The double smoothing process introduces a delay, making the TMA slower to react to sudden price changes.
- Complexity: Calculating the TMA can be more complex than the SMA, especially for those new to technical analysis.
- Sensitivity: It might miss short-term trading opportunities due to its focus on smoothing.
Conclusion
The Triangular Moving Average is a valuable tool for traders seeking to understand long-term market trends. By providing a smoother representation of price data, it helps reduce noise and enhances trend analysis. However, its lagging nature means it’s best used in conjunction with other indicators to gain a comprehensive view of the market. Overall, the TMA is a useful addition to a trader’s toolkit for making informed decisions.