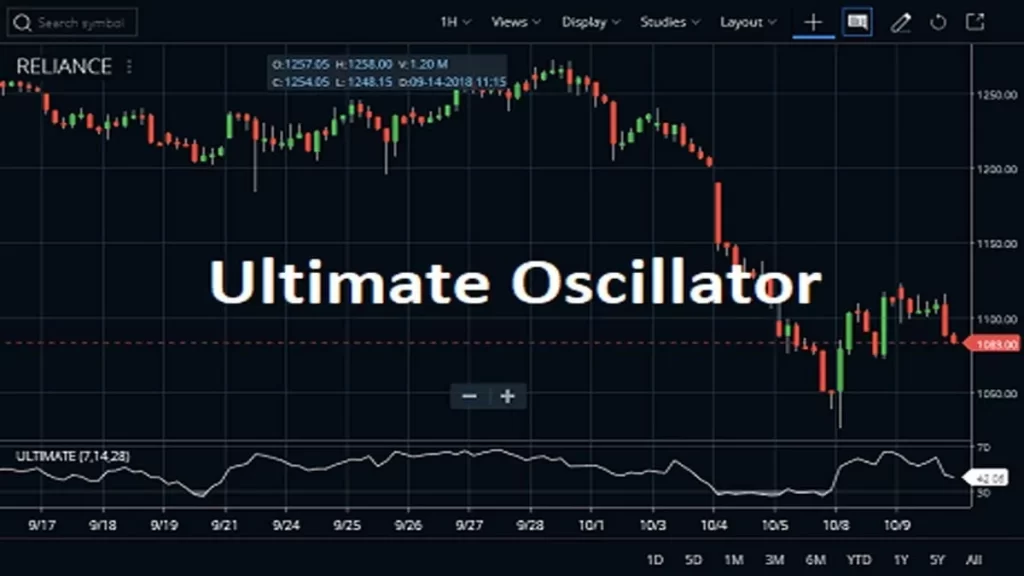
What is the Ultimate Oscillator?

What is the Ultimate Oscillator?
The Ultimate Oscillator is a tool used by traders to help decide when to buy or sell stocks. It looks at three different time periods to get a balanced view of market momentum:
- Short-Term (7-period): Responds quickly but might react too early.
- Intermediate-Term (14-period): Provides a middle ground.
- Long-Term (28-period): Responds slowly but might miss early changes.
By combining these timeframes, the Ultimate Oscillator aims to show when prices are too high (overbought) or too low (oversold), indicating potential turning points for buying or selling.
How to Use the Ultimate Oscillator
Buy Signal:
- Bullish Divergence: If the price of a stock drops to a new low but the oscillator does not drop as much, it may suggest a buying opportunity.
- Confirmation: Draw a line where the oscillator peaked before dropping. If it rises above this line, it confirms a potential buy.
Example: On a chart, if the Ultimate Oscillator shows a higher low while the stock price makes a lower low, it signals a potential buy after the oscillator breaks above its previous high.
Sell Signal:
- Overbought Area: The oscillator must be above 70.
- Bearish Divergence: Price hits a new high, but the oscillator hits a lower high.
- Breakout: The oscillator drops below the lowest point during divergence.
Example: If the Ultimate Oscillator is above 70 and the stock price makes a new high but the oscillator does not, it suggests a sell signal when the oscillator drops below its recent low.
Why Use the Ultimate Oscillator?
The Ultimate Oscillator is useful because it combines multiple timeframes to provide a more reliable signal than using a single timeframe. It helps traders identify potential buy or sell points by showing when the market may be overbought or oversold, allowing traders to make informed decisions.
Example in Practice
Imagine you are trading a stock, and you notice the price has dropped to a new low. However, the Ultimate Oscillator indicates a higher low. This could mean buyers are stepping in, despite the drop in price, suggesting a buying opportunity. Similarly, if the stock price hits a new high, but the Ultimate Oscillator shows a lower high, it may suggest that the stock is overbought and a sell might be coming.
Final Thoughts
Understanding and using the Ultimate Oscillator can help traders anticipate market reversals and confirm price trends. It’s a valuable tool for analyzing momentum and making more informed trading decisions.