Understanding Fibonacci Arcs
Fibonacci Arcs: How Traders Use This Technical Analysis Tool
Fibonacci arcs are a technical analysis tool used to help traders identify potential levels of support and resistance on a price chart. In this guide, we’ll explain what Fibonacci arcs are, how to use them, and how they can provide valuable insights for making trading decisions.
What Are Fibonacci Arcs?
Fibonacci arcs are drawn using the Fibonacci sequence, which is a series of numbers where each number is the sum of the two preceding ones (e.g., 1, 1, 2, 3, 5, 8, 13, 21, etc.). These arcs are used to project potential support and resistance levels based on the Fibonacci ratios: 23.6%, 38.2%, 50%, 61.8%, and 100%.
To draw Fibonacci arcs, follow these steps:
- Identify Significant Highs and Lows: Start by finding a significant high and low on your chart. For example, if you are analyzing an uptrend, locate the lowest point of the trend and the highest point.
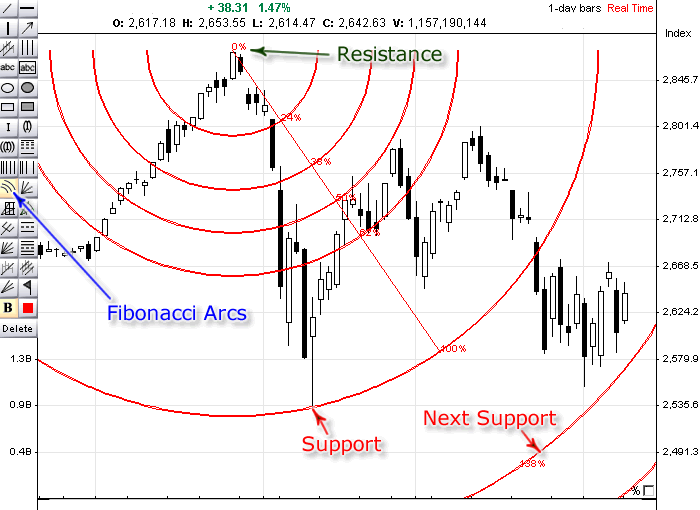
- Draw the Fibonacci Arcs: Using charting software, draw a trendline between the significant high and low. The software will then draw arcs at the key Fibonacci levels (31.8%, 38.2%, 50%, 61.8%, and 100%) as semi-circles that extend from the base trendline.
How to Use Fibonacci Arcs
Fibonacci arcs help traders understand potential price levels where the market might reverse direction. Here’s how to interpret the arcs:
- Support and Resistance:
- Support Levels: In an uptrend, Fibonacci arcs can act as support levels. If the price falls and hits one of the arc levels, it might find support and reverse upwards.
- Resistance Levels: In a downtrend, the arcs can act as resistance levels. If the price rises and hits one of the arc levels, it might find resistance and reverse downwards.
- Price Reactions:
- Resistance Reversal: If the price hits a Fibonacci arc level and struggles to move higher, that level is likely acting as resistance. If the price breaks through this level, it may continue to the next Fibonacci arc level.
- Support Reversal: If the price falls to a Fibonacci arc level and bounces back up, that level is likely providing support. If the price breaks below this level, it may continue to the next Fibonacci arc level.
Example Chart Analysis
Let’s look at an example using the S&P 500 exchange-traded fund (SPY) to understand how Fibonacci arcs work in practice.
Chart Analysis
- Identify Key Points: Suppose SPY had a major high at $250 and a major low at $200.
- Draw the Base Trendline: Draw a trendline from the $200 low to the $250 high. Your charting software will then draw Fibonacci arcs based on this trendline.
Example Scenario
- Resistance at 50% Arc: After a significant bear market, the SPY starts to rally. The price approaches the 50% Fibonacci arc, which acts as resistance. The price struggles to move above this level and starts to fall back.
- Support at 38.2% Arc: As the price declines, it finds support at the 38.2% Fibonacci arc. The price bounces between the 50% arc (resistance) and the 38.2% arc (support) for several months.
- New Resistance Level: After breaking through the 50% resistance arc, the price continues to rise and hits the 61.8% Fibonacci arc, which then becomes a new resistance level. The previous 50% resistance arc now acts as support.
How to Trade with Fibonacci Arcs
- Start with a Charting Platform: To use Fibonacci arcs, you’ll need a charting platform that offers this tool. Popular platforms include TradingView, MetaTrader, and Thinkorswim.
- Draw Fibonacci Arcs on the Chart:
- Select a significant high and low on your chart.
- Draw the Fibonacci arcs from these points using your charting software.
- Monitor Price Interactions: Observe how the price interacts with the Fibonacci arcs. Look for areas where the price either finds support or resistance at the arc levels.
- Combine with Other Tools: Use Fibonacci arcs alongside other technical analysis tools, such as moving averages or trend lines, to confirm signals and make more informed trading decisions.
- Adjust and Reassess: As new price data becomes available, adjust your Fibonacci arcs to reflect current market conditions. Reassess the levels periodically to ensure they still provide relevant support or resistance.
Further Reading
For more detailed information on Fibonacci tools, you might explore other related concepts like Fibonacci retracements, Fibonacci fans, and Fibonacci time zones. Each of these tools offers different ways to analyze price movements and can complement the use of Fibonacci arcs in your trading strategy.
Conclusion
Fibonacci arcs are a valuable tool in technical analysis, helping traders identify potential support and resistance levels based on Fibonacci ratios. By drawing and analyzing these arcs on a price chart, traders can gain insights into where the price might reverse direction and make more informed trading decisions.
However, it’s important to use Fibonacci arcs in conjunction with other technical indicators and market analysis techniques to build a comprehensive trading strategy. With practice and experience, Fibonacci arcs can become an effective part of your trading toolkit.