Window Candle Stick Pattern

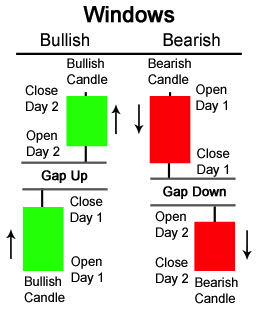
Windows as they are called in Japanese Candlestick Charting, or Gaps, as they are called in the west, are an important concept in technical analysis. Whenever, there is a gap (current open is not the same as prior closing price), that means that no price and no volume transacted hands between the gap.

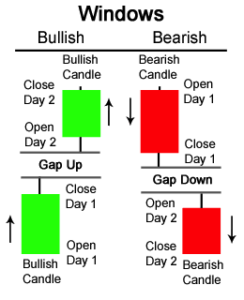
A Gap Up occurs when the open of Day 2 is greater than the close of Day 1.
Contrastly, a Gap Down occurs when the open of Day 2 is less than the close of Day 1.
There is much psychology behind gaps. Gaps can act as:
Resistance: Once price gaps downward, the gap can act as resistance.
Support: When prices gap upwards, the gap can act as support to prices in the future.
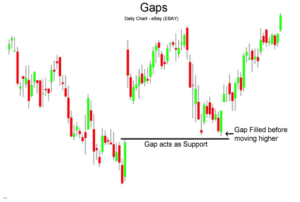
Windows Example – Gaps as Support and Resistance The chart below of eBay (EBAY) stock shows the gap up acting as support for prices.

Often after a gap, prices will do what is referred to as “fill the gap”. This occurs quite often. Think of a gap as a hole in the price chart that needs to be filled back in. Another occurance with gaps is that once gaps are filled, the gap tends to reverse direction and continue its way in the direction of the gap (for example, in the chart above of eBay, back upwards).
The example of eBay (EBAY) above shows the gap acting as support. Traders and traders see anything below the gap as an area of no return, after all, there was probably some positive news that sparked the gap up and might still be in play for the company.
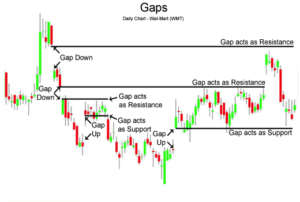
The chart below of Wal-Mart (WMT) stock shows many instances of gaps up and gaps down. Notice how gaps down can act as areas of resistance and gaps up can act as areas of support:

Gaps are important areas on a chart that can help a technical analysis trader better find areas of support or resistance. For more information on how support and resistance work, (see: Support & Resistance). Also, Gaps are an important part of most Candlestick Charting patterns; (see: Candlestick Basics) for a list of candlestick pattern charts and descriptions.
The information above is for informational and entertainment purposes only and does not constitute trading advice or a solicitation to buy or sell any stock, option, future, commodity, or forex product. Past performance is not necessarily an indication of future performance. Trading is inherently risky. Commodity.com shall not be liable for any special or consequential damages that result from the use of or the inability to use, the materials and information provided by this site.