Doji Candlestick Pattern

The Doji is an transitional Candlestick formation, signifying equality and/or indecision between bulls and bears. A Doji is quite often found at the bottom and top of trends and thus is considered as a sign of possible reversal of price direction, but the Doji can be viewed as a continuation pattern as well.
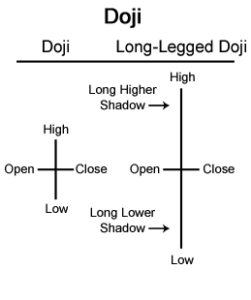
A Doji is formed when the opening price and the closing price are equal. A long-legged Doji, often called a “Rickshaw Man” is the same as a Doji, except the upper and lower shadows are much longer than the regular Doji formation.
The creation of the Doji pattern illustrates why the Doji represents such indecision. After the open, bulls push prices higher only for prices to be rejected and pushed lower by the bears. However, bears are unable to keep prices lower, and bulls then push prices back to the opening price.
Of course, a Doji could be formed by prices moving lower first and then higher second, nevertheless, either way, the market closes back where the day started. The chart below of General Electric (GE) shows two examples of Doji’s:
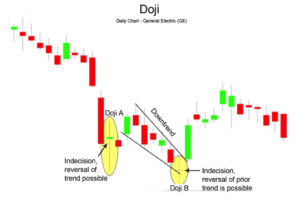
In a Doji pattern, the market explores its options both upward and downward, but cannot commit either way. After a long uptrend, this indecision manifest by the Doji could be viewed as a time to exit one’s position, or at least scale back. Similarly, after a long downtrend, like the one shown above of General Electric stock, reducing one’s position size or exiting completely could be an intelligent move.
It is important to emphasize that the Doji pattern does not mean reversal, it means indecision. Doji’s are often found during periods of resting after a significant move higher or lower; the market, after resting, then continues on its way. Nevertheless, a Doji pattern could be interpreted as a sign that a prior trend is losing its strength, and taking some profits might be well advised.
Two intra-day examples of how a daily Doji formation is created is presented on the next page.
Intra-day Doji Formation
The first Doji outlined on the daily chart of General Electric on the previous page was a high-low Doji, where prices made the highs for the day first, and the lows for the day second. The intra-day chart (15-minute) of this occurance is given below:

At the opening, the bulls were in charge; however, the morning rally did not last long before the bears took charge. From mid-morning until late-afternoon, General Electric sold off, but by the end of the day, bulls pushed GE back to the opening price of the day.
The second Doji daily chart on the previous page is shown next. In the intra-day chart below (Doji B), the Doji was created the exact opposite way as the chart shown above (Doji A) was created; Doji B made its day’s lows first, then highs second.

At the opening bell, bears took a hold of GE, but by mid-morning, bulls entered into GE’s stock, pushing GE into positive territory for the day. Unfortunately for the bulls, by noon bears took over and pushed GE lower. By the end of the day, the bears had successfully brought the price of GE back to the day’s opening price.
As was presented above, the Doji formation can be created two different ways, but the interpretation of the Doji remains the same: the Doji pattern is a sign of indecision, neither bulls nor bears can successfully take over.
Two important variations of the Doji formation are linked below:
The information above is for informational and entertainment purposes only and does not constitute trading advice or a solicitation to buy or sell any stock, option, future, commodity, or forex product. Past performance is not necessarily an indication of future performance. Trading is inherently risky. Commodity.com shall not be liable for any special or consequential damages that result from the use of or the inability to use, the materials and information provided by this site.