Accumulative Swing Index
The Accumulative Swing Index (ASI) is a technical indicator developed by Welles Wilder, used mainly as a divergence and confirmation tool in trading. It is a running total of the Swing Index and can be applied to various markets, including futures, stocks, and currencies. The ASI can confirm trends and potential buy or sell signals when it breaks above or below trendlines or key resistance and support levels, respectively. It is most effective when used in conjunction with other technical indicators and chart patterns such as support and resistance indicators.
This guide explains the Accumulative Swing Index (ASI), a useful tool for traders in technical analysis. Developed by Welles Wilder in his book “New Concepts in Technical Trading Systems,” ASI serves as a confirmation and divergence indicator, and it can also provide buy and sell signals. Let’s understand it with a simple example chart.
The Accumulative Swing Index is like a running total of the Swing Index, and it can be used in different markets like futures, stocks, and currencies. In the example chart, we see how ASI confirmed the downtrend in Gold. When Gold broke the downward trendline, ASI also confirmed the trendline break. Similarly, the upward move in Gold futures was confirmed by ASI when it broke the upward trendline.
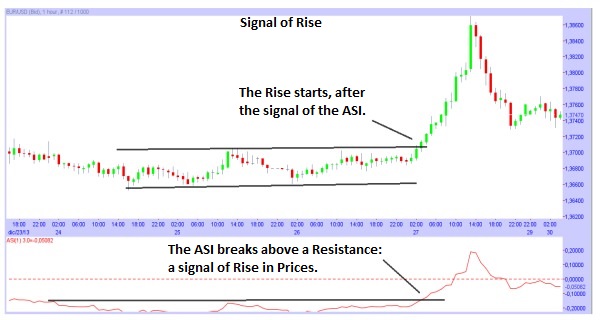
To use ASI effectively, traders can look for potential buy signals when ASI breaks above a downward trendline or above resistance during a price consolidation period. Conversely, potential sell signals can be considered when ASI breaks below an upward trendline or below support in a price consolidation period.
In summary, the Accumulative Swing Index works best as a confirmation tool when used alongside other technical indicators and chart patterns, such as support and resistance indicators. By combining these tools, traders can make more informed decisions in their trading strategies.