Advance Decline Ratio
Advance Decline Ratio: A Key Indicator to Uncover Market Sentiment
In the vast world of financial markets, understanding the overall sentiment and strength of market movements is crucial for successful trading. The Advance Decline Ratio (ADR) is a powerful yet simple tool that helps traders gauge the breadth of market participation and identify potential turning points. Let’s explore what ADR is, its historical significance, its advantages and disadvantages, and when to use it for making effective buy and sell decisions.
What is Advance Decline Ratio (ADR)?
The Advance Decline Ratio, also known as the Advance Decline Line or A/D line, is a technical indicator that measures the number of advancing securities (stocks, indexes, or other assets) versus the number of declining ones within a given period. It is a straightforward calculation that shows the health of the market by comparing the number of stocks moving higher versus those moving lower.
History and Development of ADR:
The concept of the Advance Decline Ratio dates back to the early 1900s when market analysts started tracking the number of advancing and declining stocks daily. However, it gained popularity and formal recognition during the 1960s when its usage expanded with the rise of electronic trading and data availability.
One of the earliest proponents of ADR was Richard W. Arms Jr., an American market technician, and creator of the Arms Index (also known as the TRIN – Trading Index). He found that analyzing market breadth through the Advance Decline Ratio provided valuable insights into market sentiment, helping traders identify potential turning points and confirming trends.
How ADR Works:
The calculation of the Advance Decline Ratio is quite simple. For each trading day, you count the number of stocks that have advanced (closed higher than the previous day) and the number of stocks that have declined (closed lower than the previous day). Then, you divide the number of advancing stocks by the number of declining stocks:
ADR = Number of Advancing Stocks / Number of Declining Stocks
The resulting value can range from 0 to 1 or can be multiplied by 100 to express it as a percentage. A value greater than 1 or a high percentage indicates a bullish market sentiment, as more stocks are advancing than declining. Conversely, a value less than 1 or a low percentage signals a bearish market sentiment, with more stocks declining than advancing.
Pros of Using ADR:
- Simplicity: The ADR is incredibly simple to calculate and understand. It doesn’t require complex mathematical models, making it accessible to both novice and experienced traders.
- Market Breadth Indicator: ADR provides insights into market breadth, indicating whether the majority of stocks are participating in the current trend. This can help traders validate the strength of the trend or detect potential reversals.
- Confirmation Tool: ADR can be used in conjunction with other technical indicators or chart patterns to confirm signals. When multiple indicators align, it adds more conviction to trading decisions.
- Early Warning Sign: A rising or falling ADR ahead of a significant price movement can act as an early warning sign of potential market shifts, allowing traders to prepare for possible opportunities or risks.
Cons of Using ADR:
- Lack of Detail: The ADR only considers the number of advancing and declining stocks, not their individual weights or market capitalization. Thus, it may not fully represent the broader market trends.
- Delayed Data: The Advance Decline Ratio relies on end-of-day data, which means the information might not be as timely as real-time indicators.
- Overbought/Oversold Signals: Extremely high or low ADR values may indicate overbought or oversold conditions. However, these conditions can persist for extended periods, leading to false signals if not interpreted carefully.
When to Buy and Sell using ADR:
Using ADR effectively requires a combination of analysis and intuition. Here’s how traders can incorporate ADR into their decision-making process:
1. Buy Signal: Look for an increasing ADR, indicating that the number of advancing stocks is rising compared to declining stocks. This suggests a broad market participation in the upward trend, supporting a potential buy opportunity.
2. Sell Signal: Conversely, when the ADR is declining, it indicates a decrease in market participation and might signal a weakening trend. Traders should exercise caution and consider taking profits or implementing hedging strategies.
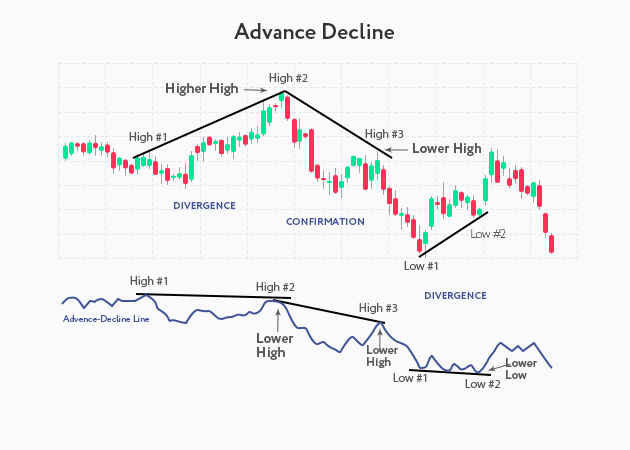
3. Divergence: Pay attention to divergences between the ADR and the price chart. If the ADR is moving in the opposite direction to the price trend, it could indicate a potential trend reversal or a weakening trend.
Conclusion:
The Advance Decline Ratio is a valuable tool that provides insights into market breadth and sentiment. Its simplicity and historical significance make it a compelling choice for traders seeking a broader perspective on market movements. However, like any indicator, it should not be used in isolation. Combining ADR with other technical tools, fundamental analysis, and risk management strategies can enhance its effectiveness. Remember, trading involves both science and art, so use the Advance Decline Ratio wisely and embrace it as a valuable addition to your trading toolbox. Happy trading!