Bearish Engulfing Candlestick Pattern

The Bearish Engulfing Candlestick Pattern is considered to be a bearish reversal pattern, usually occurs at the top of an uptrend. The pattern consists of two Candlesticks:
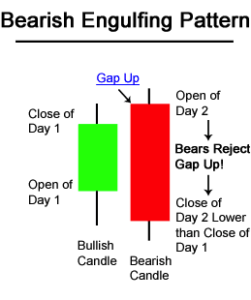
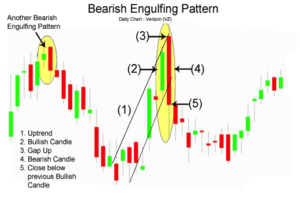
Smaller Bullish Candle (Day 1) Larger Bearish Candle (Day 2) Generally, the bullish candle real body of Day 1 is contained within the real body of the bearish candle of Day 2. The market gaps up (typically interpreted as a bullish sign) on Day 2; however, the bulls do not push very far higher before bears take over and push prices further down, not only filling in the gap down from the morning’s open but also pushing prices below the previous day’s open (viewed as a bearish sign). With the Bullish Engulfing Pattern, there is an incredible change of sentiment from the bullish gap up at the open, to the large bearish real body candle that closed at the lows of the day. Bears have successfully overtaken bulls for the day and possibly for the next few periods. The chart below of Verizon (VZ) stock shows an example two Bearish Engulfing Patterns occuring at the end of uptrends:
Bearish Engulfing Potential Sell Signal
Three methodologies for selling using the Bearish Engulfing Pattern are listed below in order of most aggressive to most conservative:
1: A trader might sell at the close of Day 2. If there is a substantial increase in volume that accompanies the large move downward in price, a trader might view this as an even stronger indication to sell.
2:Also, a trader might sell on the day after the Bearish Engulfing Pattern occurs; by waiting until the next day to sell, a trader is trying to verify that the bearish reversal pattern is for real and was not just a one day occurance. In the chart above of Verizon, a trader would probably entered on the day after the Bearish Engulfing Pattern because the selling continued.
3:Usually trader’s wait for other signals, such as a price break below the upward support line (see: Support & Resistance), before entering a sell order. However, in the case of Verizon above, the Bearish Engulfing Pattern occured at the same time as the trendline break below support.
An example of what usually occurs intra-day during a Bearish Engulfing Pattern is presented on the next page. Intra-day Bearish Engulfing Pattern The following 15-minute chart of Verizon (VZ) is of the 2-day period comprising the Bearish Engulfing Pattern example on the prior page:
Intra-day Bearish Engulfing Pattern The following 15-minute chart of Verizon (VZ) is of the 2-day period comprising the Bearish Engulfing Pattern example on the prior page:
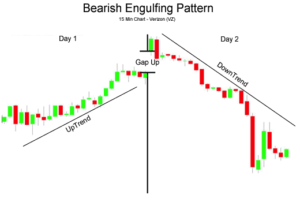
Day 1: As is seen in the chart above, Day 1 was an up day, closing near the day’s high (bullish sentiment).
Day 2: The open was a gap up, a very bullish sign; nevertheless, the bulls ran out of buying pressure and prices fell the rest of the day, closing near the day’s lows (bearish sentiment) and lower than Day 1’s lows.
The Bearish Engulfing Pattern’s opposite is the Bullish Engulfing Pattern (see: Bullish Engulfing Pattern).
The information above is for informational and entertainment purposes only and does not constitute trading advice or a solicitation to buy or sell any stock, option, future, commodity, or forex product. Past performance is not necessarily an indication of future performance. Trading is inherently risky. Commodity.com shall not be liable for any special or consequential damages that result from the use of or the inability to use, the materials and information provided by this site.