Double Bottom
Double Bottom: A Twin Sign of Reversal
In the exciting realm of financial markets, identifying potential trend reversals is a key skill for successful trading. The Double Bottom, a powerful and widely recognized chart pattern, offers traders a unique way to spot potential bullish reversals in an asset’s price movement. In this comprehensive guide, we will delve into what the Double Bottom pattern is, explore its historical significance, examine its pros and cons, and learn how to effectively buy and sell using this chart pattern to maximize trading opportunities.
What is a Double Bottom?
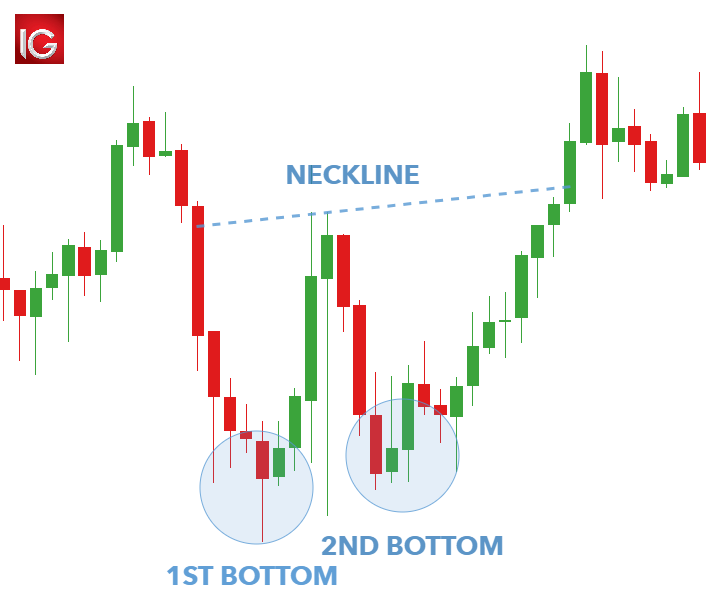
The Double Bottom is a bullish reversal chart pattern that forms after a prolonged downtrend. It is characterized by two distinct troughs (or lows) of approximately the same price level, separated by a peak (or high) between them. The pattern signifies that selling pressure has reached a bottom twice, but each time the price failed to sustain the downward movement. As a result, the price is expected to reverse and start an upward movement, potentially indicating a new uptrend.
Identification and Characteristics:
To identify a Double Bottom pattern, traders should look for the following characteristics:
- Downtrend: The pattern should occur after a noticeable downtrend, where the price is making lower lows and lower highs.
- Two Lows: The price should form two distinct troughs, where the second low is approximately at the same price level as the first low. The lows are separated by a peak in between.
- Volume: Volume tends to be higher during the formation of the two lows, indicating increased buying interest and potential accumulation by traders.
- Neckline: The neckline is a horizontal line drawn through the peak between the two lows. It acts as a crucial level of resistance that needs to be broken for the pattern to confirm.
How to Buy and Sell Using the Double Bottom:
1. Buying Strategy:
The buying strategy involves the following steps:
a. Confirmation: Wait for a confirmed break above the neckline. The pattern is only considered valid when the price closes above the neckline.
b. Volume Confirmation: Ideally, look for higher trading volume during the breakout, indicating strong buying interest and conviction in the upward move.
c. Entry Point: Enter the trade when the price breaks above the neckline. This confirms the pattern’s validity, and the asset is expected to move higher.
d. Stop-loss Placement: Place a stop-loss order below the second low of the pattern. This protects against potential false breakouts and limits losses if the price reverses.
e. Target Price: Measure the distance between the lowest low (the trough) and the neckline. Then, project this distance upwards from the neckline to set a target price for the potential uptrend.
2. Selling Strategy:
The selling strategy can be implemented in two ways:
a. Conservative Approach: Wait for a confirmed break above the neckline and a significant move higher. Then, observe for signs of potential reversal or a bearish divergence in other technical indicators. If such signals emerge, consider selling to lock in profits.
b. Aggressive Approach: If the price fails to break above the neckline and reverses downwards, traders can sell at or near the neckline to take advantage of potential resistance and a continuation of the downtrend.
History of the Double Bottom:
The Double Bottom pattern has been observed and studied by traders and analysts for decades. Its significance lies in its ability to signal potential trend reversals and its simplicity, making it widely recognized and used by traders across various financial markets.
Although its origin is not well-documented, the Double Bottom pattern became popular with the advent of technical analysis and the use of charts to study price movements. Over time, traders noticed the recurring nature of this pattern and its effectiveness in identifying potential bullish reversals, leading to its widespread adoption in trading strategies.
Pros of the Double Bottom:
- Reversal Signal: The Double Bottom provides a clear and actionable signal for potential trend reversals in a downtrend, helping traders identify new buying opportunities.
- Confirmation: The pattern’s validity is confirmed by a break above the neckline, reducing the likelihood of false signals.
- Simple to Recognize: The Double Bottom pattern is relatively easy to identify on price charts, making it accessible to both new and experienced traders.
- Price Targets: The pattern offers a specific price target based on the distance between the trough and the neckline, helping traders set profit objectives.
Cons of the Double Bottom:
- False Signals: While the Double Bottom is reliable in many instances, there is always a risk of false signals, especially in volatile or unpredictable markets.
- Subjectivity: Identifying the pattern can be subjective, and different traders may interpret it differently.
- Timeframe Sensitivity: The pattern’s effectiveness may vary depending on the timeframe used for analysis, leading to different interpretations.
- No Guarantee: Like all technical analysis tools, the Double Bottom cannot guarantee future price movements and may not always accurately predict market behavior.
Conclusion:
The Double Bottom is a valuable chart pattern that provides traders with a clear and actionable signal for potential bullish reversals in a downtrend. Its simplicity, confirmation criteria, and potential price targets make it a compelling tool for identifying new buying opportunities.
However, traders should exercise caution and use the Double Bottom in conjunction with other technical indicators and risk management strategies. No pattern or tool can guarantee 100% accuracy, and successful trading requires a comprehensive approach that combines analysis, discipline,