Exponential Ribbons
Exponential Ribbons (also known as EMAs Ribbons or Moving Averages Ribbons) is a technical analysis tool used in trading to identify trends and potential buy/sell signals. It is based on multiple exponential moving averages (EMAs) of varying periods, plotted on the price chart as overlapping ribbons. Each ribbon represents a different EMA, and their convergence and divergence help traders assess trend strength and potential entry and exit points.
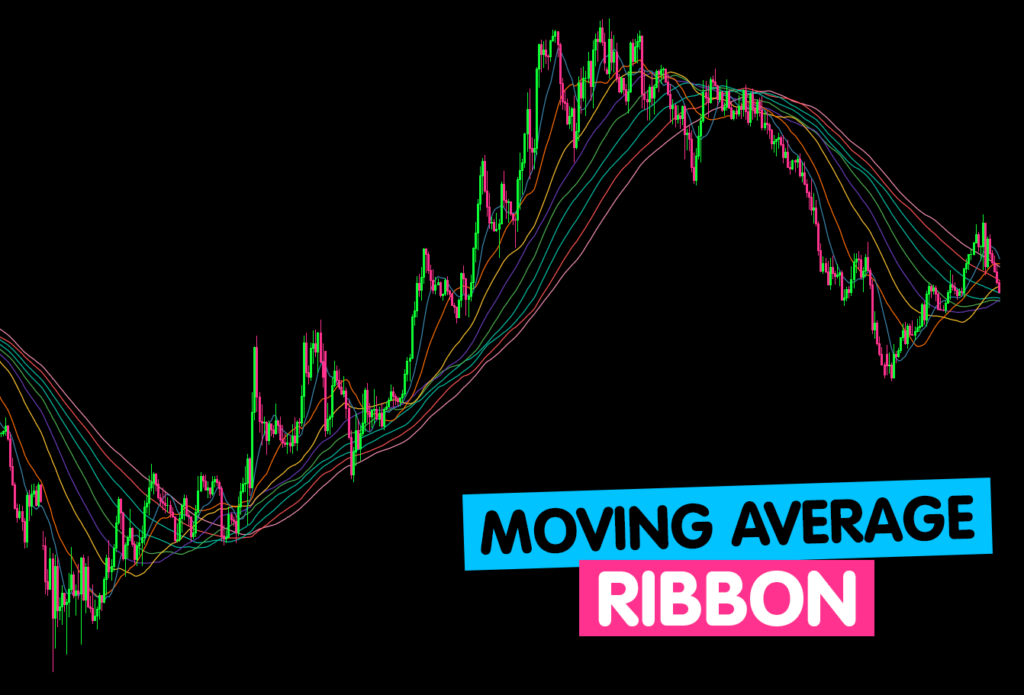
How Exponential Ribbons Work: Exponential Ribbons are created by plotting multiple EMAs with different periods, such as 8, 13, 21, 34, 55, and so on. These EMAs are calculated based on the closing prices of the asset over their respective periods. When plotted on the price chart, the ribbons appear as smooth curves that flow with the price movements.
- Identifying Trends: The convergence of EMAs in an upward direction indicates a bullish trend, while a downward convergence signals a bearish trend. The spacing between the ribbons can also indicate trend strength, with wider gaps suggesting a stronger trend.
- Buy Signals: A common buy signal is generated when the shorter-term EMAs cross above the longer-term EMAs. This indicates a potential shift to a bullish trend, prompting traders to consider opening long positions.
- Sell Signals: Conversely, a sell signal occurs when the shorter-term EMAs cross below the longer-term EMAs. This indicates a potential shift to a bearish trend, prompting traders to consider opening short positions.
Timing Buy and Sell Decisions: The timing of buy and sell decisions using Exponential Ribbons is based on the crossover of EMAs. Traders look for convergence and divergence patterns among the ribbons, especially the shorter-term and longer-term EMAs. Some traders prefer to wait for multiple EMAs to confirm the signal before entering a trade.
For example, a trader might wait for the 8-day EMA to cross above the 13-day EMA, and both of them to cross above the 21-day EMA, indicating a bullish trend. Conversely, for a sell signal, the 8-day EMA might cross below the 13-day EMA, and both of them to cross below the 21-day EMA, indicating a bearish trend.
Pros of Exponential Ribbons:
- Trend Identification: Exponential Ribbons help traders identify trends and trend reversals, enhancing their ability to make profitable trades.
- Smoothing Effect: The use of multiple EMAs in ribbons creates a smoothing effect, reducing noise in the price chart and making it easier to identify the underlying trend.
- Versatility: Exponential Ribbons can be applied to various assets and timeframes, making them suitable for different trading strategies.
Cons of Exponential Ribbons:
- Lagging Indicator: Like all moving averages, Exponential Ribbons are lagging indicators, meaning they are based on past price data and may not reflect real-time price movements accurately.
- False Signals: Exponential Ribbons can generate false signals, especially during periods of low volatility or choppy markets. Traders must use additional confirmation tools to validate signals.
- Subjectivity: The choice of EMA periods and interpretation of signals can be subjective, leading to different interpretations among traders.
History of Exponential Ribbons: The concept of using multiple EMAs in ribbons is based on the principles of moving averages, which have been used in technical analysis for many decades. The specific term “Exponential Ribbons” and its exact implementation might not have a specific historical reference as it is a customized approach to trading based on the combination of EMAs.
Traders and analysts have been experimenting with various combinations of EMAs to identify trends and potential trading opportunities. The use of Exponential Ribbons gained popularity with the advancements in technical analysis software and charting platforms, making it easier for traders to visualize and apply these ribbons on price charts.
In conclusion, Exponential Ribbons are a popular technical analysis tool that uses multiple EMAs to identify trends and potential trading signals. Traders use these ribbons to make buy and sell decisions based on the crossover of EMAs. While they offer valuable insights into market trends, traders must exercise caution and use additional confirmation tools to validate signals and avoid false indications. Like any trading strategy, it is essential to backtest and validate the effectiveness of Exponential Ribbons before integrating them into a trading plan.