Flag Trading Pattern

The Flag pattern usually occurs after a significant up or down market move. After a strong move, prices usually need to rest. This resting period usually occurs in the shape of a rectangle, thus the word “flag”. The Flag is considered a continuation pattern because after resting, prices will usually continue in the direction they did before.
The chart of eBay (EBAY) shows many Flag patterns:
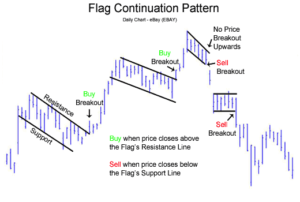
Flag Potential Buy Signal When price has moved higher and prices have consolidated, creating a channel of support and resistance, a potential buy signal is given when prices penetrate and close above the upward resistance line. Flag Potential Sell Signal Assuming prices previously moved downward, then after a period of price consolidation, a potential sell signal is given when price penetrates and closes below the support line. For more information on the concept of support and resistance, (see: Support & Resistance). Another similar pattern discussed is Triangles (see: Triangles).
The information above is for informational and entertainment purposes only and does not constitute trading advice or a solicitation to buy or sell any stock, option, future, commodity, or forex product. Past performance is not necessarily an indication of future performance. Trading is inherently risky. Commodity.com shall not be liable for any special or consequential damages that result from the use of or the inability to use, the materials and information provided by this site. Read More>>