Gann Theory

What is Gann Theory?
Gann Theory, developed by financial trader and analyst W.D. Gann in the early 20th century, is a method of technical analysis used to predict price movements and identify trading opportunities in financial markets. Gann believed that price movements were influenced by both time and price, and he used various geometric and mathematical tools to analyze charts and identify patterns.
Key concepts of Gann Theory include:
- Gann Angles: Gann used angles drawn on price charts to indicate potential support and resistance levels. These angles, often drawn at 45-degree increments, are used to identify trendlines and potential turning points.
- Gann Squares: Gann created a tool called the Gann Square of Nine, which is a spiral-shaped chart used to identify price and time relationships. Traders use this tool to identify potential price targets and time periods for price movements.
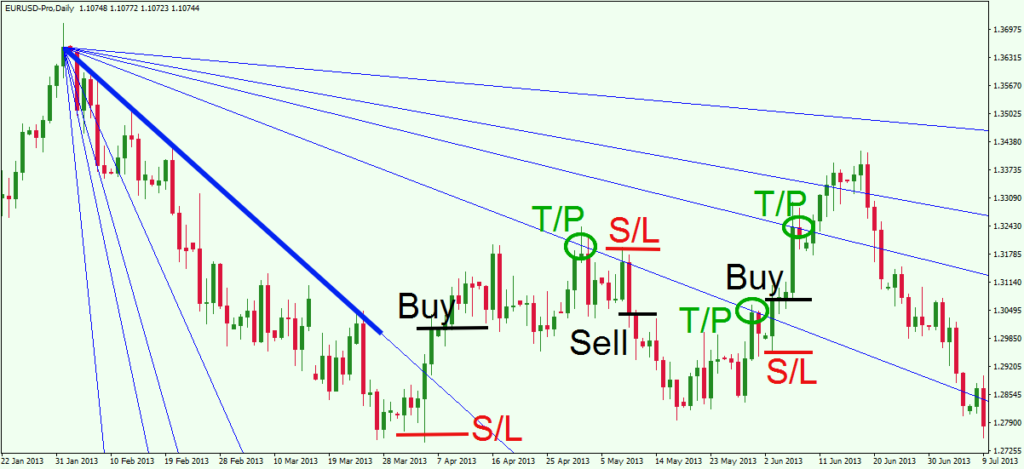
- Gann Fan: The Gann Fan consists of diagonal lines drawn from a significant price point and is used to identify potential areas of support and resistance.
- Time and Price Ratios: Gann believed that specific ratios between time and price movements could help predict future price movements. Traders use these ratios to identify potential reversal points and price targets.
Gann Theory is considered a complex and esoteric form of technical analysis, and not all traders use it in their trading strategies. It requires a deep understanding of Gann’s methods and principles to effectively apply it to real trading scenarios. As with any form of technical analysis, traders should use Gann Theory in conjunction with other analysis tools and methods to make well-informed trading decisions.
Buying and selling using Gann Theory involves identifying potential price targets, support, and resistance levels based on Gann’s geometric and mathematical principles. Here are some steps to apply Gann Theory in your trading:
Step 1: Identify Significant Price Points:
- Start by identifying significant high and low price points on the price chart. These points will serve as reference points for drawing Gann angles and lines.
Step 2: Draw Gann Angles:
- Use Gann angles to draw trendlines on the price chart. Gann angles are typically drawn at 45-degree increments, representing potential support and resistance levels.
- The angles that are closer to the horizontal (0-degree angle) are considered more important and can act as strong support or resistance levels.
Step 3: Use Gann Fan:
- Draw the Gann Fan using a significant price point as the starting point. The Gann Fan consists of diagonal lines that radiate from the starting point and can help identify potential support and resistance levels.
Step 4: Analyze Time and Price Relationships:
- Look for significant time and price relationships based on Gann’s principles, such as important time cycles or price ratios.
- Identify potential turning points or price targets based on these relationships.
Step 5: Combine with Other Indicators:
- Use Gann Theory in combination with other technical indicators or chart patterns to validate potential buy or sell signals.
- Confirm Gann Theory signals with other forms of analysis, such as moving averages, trendlines, or volume analysis.
Step 6: Risk Management:
- Implement proper risk management techniques to protect your capital. Set stop-loss levels to limit potential losses in case the trade goes against your prediction.
Step 7: Practice and Patience:
- Gann Theory requires practice and patience. Test your strategies on historical data or in a demo trading environment before applying them to real trades.
It’s important to note that Gann Theory is not foolproof, and its effectiveness may vary across different markets and timeframes. It’s essential to stay disciplined, avoid overfitting, and continuously monitor the market for any changes or new signals. As with any trading approach, risk management and proper analysis are key to successful trading using Gann Theory.
Pros and Cons
Pros of Gann Theory:
- Predictive Potential: Gann Theory is based on the idea that price movements are influenced by time and price relationships, which can provide traders with potential future price targets and turning points.
- Versatility: Gann Theory can be applied to various financial markets, including stocks, commodities, forex, and cryptocurrencies.
- Time and Price Analysis: The theory combines time and price analysis, providing traders with a comprehensive view of market movements.
- Long-Term Analysis: Gann Theory can be applied to long-term charts, making it suitable for traders with a long-term investment perspective.
Cons of Gann Theory:
- Complexity: Gann Theory can be complex and challenging to understand, especially for beginner traders. It requires a thorough understanding of Gann’s principles and techniques.
- Subjectivity: Interpretation of Gann angles, lines, and patterns can be subjective, leading to different conclusions among traders.
- Lack of Empirical Evidence: Gann Theory is based on geometric and mathematical principles, but it lacks empirical evidence to support its predictive abilities.
- Time-Consuming Analysis: Applying Gann Theory requires significant time and effort, which may not be practical for all traders, particularly those who prefer faster analysis methods.
- Mixed Success: The effectiveness of Gann Theory in predicting price movements is a subject of debate. While some traders swear by its principles, others find it unreliable.
- Overfitting Risk: With its numerous angles and lines, there’s a risk of overfitting Gann Theory to historical data, which may not lead to accurate predictions in real-time trading.
As with any technical analysis tool, Gann Theory has its strengths and weaknesses. Traders should thoroughly study and understand the theory before incorporating it into their trading strategies. It’s essential to use Gann Theory in conjunction with other analysis methods and risk management techniques to make informed trading decisions.