Pros and Cons of Bullish Engulfing Pattern

Bullish Engulfing Candlestick Pattern:
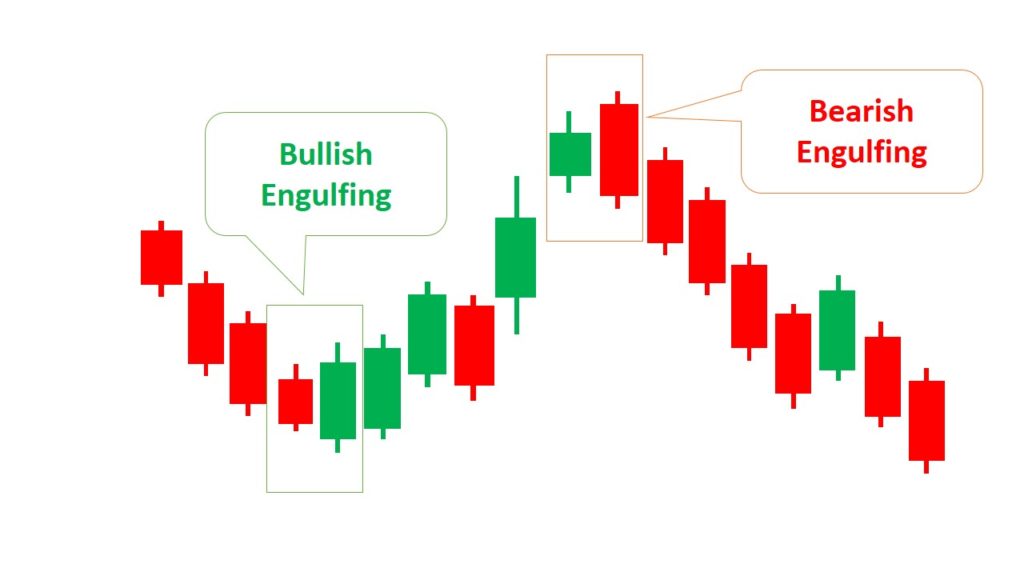
The Bullish Engulfing pattern is a popular candlestick pattern in technical analysis used to identify potential trend reversals in financial markets. It occurs during a downtrend and consists of two candlesticks. The first candlestick is a bearish one (red or black) indicating a price decline, followed by a larger bullish candle (green or white) that engulfs the entire body of the previous candlestick. This pattern suggests a possible shift in market sentiment, indicating that the bulls may take control, leading to a potential price increase.
Pros of Bullish Engulfing:
- Clear Reversal Signal: The Bullish Engulfing pattern is easy to identify on price charts, providing traders with a clear signal of a potential trend reversal.
- Confirmation of Uptrend: When the pattern occurs after a prolonged downtrend, it offers confirmation that the market sentiment is shifting, helping traders to make informed decisions.
- Risk Management: Traders can use the pattern to set stop-loss orders or exit short positions, protecting them from potential losses if the price continues to rise.
- Confluence with Other Indicators: The pattern’s effectiveness can be enhanced when it aligns with other technical indicators or support/resistance levels.
Cons of Bullish Engulfing:
- False Signals: Like any technical pattern, the Bullish Engulfing pattern can sometimes give false signals, leading to potential losses if traders act solely on this pattern without considering other factors.
- Subjectivity: Different traders may interpret the pattern differently, leading to subjective analysis and varying responses, which can affect trading decisions.
- Context Matters: Isolated patterns may not provide enough context for making accurate predictions. Traders should consider other factors like market sentiment, fundamental analysis, and overall trend direction.
History of Candlestick Charting:
Candlestick charting, which includes patterns like the Bullish Engulfing, has a long and fascinating history. It originated in Japan during the 18th century when a rice trader named Homma Munehisa developed the foundational concepts of candlestick charting to analyze rice price movements. The charting method was initially used in the rice trade but later spread to other commodities and financial markets.
Homma’s work was further refined and expanded upon by later Japanese traders, and the candlestick patterns gained widespread popularity. In the 20th century, candlestick charting was introduced to the Western world by Steve Nison, a renowned technical analyst. Nison’s book, “Japanese Candlestick Charting Techniques,” brought candlestick charting to a broader audience and revolutionized technical analysis in Western markets.
Quotes Related to Trading and Bullish Engulfing:
- “The stock market is filled with individuals who know the price of everything, but the value of nothing.” – Philip Fisher
- “The market is a device for transferring money from the impatient to the patient.” – Warren Buffett
- “The biggest risk is not taking any risk. In a world that is changing quickly, the only strategy that is guaranteed to fail is not taking risks.” – Mark Zuckerberg
- “The four most dangerous words in investing are: ‘This time, it’s different.'” – Sir John Templeton
- “The most important quality for an investor is temperament, not intellect.” – Warren Buffett
In conclusion, the Bullish Engulfing pattern is a simple and effective tool in technical analysis, used to identify potential trend reversals in financial markets. While it has its pros and cons, traders should combine it with other technical indicators and analysis methods for better decision-making. Candlestick charting, including the Bullish Engulfing pattern, has a fascinating history and continues to be a valuable tool for traders and investors worldwide.