Shooting Star Candlestick Patterns

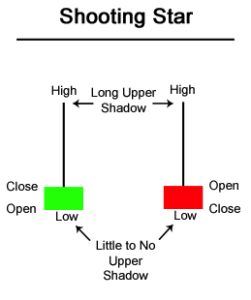 The Shooting formation is created when the open, low, and close are roughly the same price. Also, there is a long upper shadow, generally defined as at least twice the length of the real body.
When the low and the close are the same, a bearish Shooting Star candlestick is formed and it is considered a stronger formation because the bears were able to reject the bulls completely plus the bears were able to push prices even more by closing below the opening price.
The Shooting Star formation is considered less bearish, but nevertheless bearish when the open and low are roughly the same. The bears were able to counteract the bulls, but were not able to bring the price back to the price at the open. The long upper shadow of the Shooting Star implies that the market tested to find where resistance and supply was located.
When the market found the area of resistance, the highs of the day, bears began to push prices lower, ending the day near the opening price. Thus, the bullish advance upward was rejected by the bears. Shooting Star Candlestick Chart Example The chart below of Cisco Systems (CSCO) illustrates a Shooting Star reversal pattern after an uptrend:
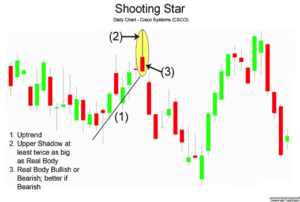 In the chart above of CSCO, the market began the day testing to find where supply would enter the market. CSCO’s stock price eventually found resistance at the high of the day. In fact, there was so much resistance and subsequent selling pressure, that prices were able to close the day significantly lower than the open, a very bearish sign.
The Shooting Star is a candlestick pattern to help traders visually see where resistance and supply is located. After an uptrend, the Shooting Star pattern can signal to traders that the uptrend might be over and that long positions could potentially be reduced or completely exited. However, other indicators should be used in conjunction with the Shooting Star candlestick pattern to determine potential sell signals, for example, waiting a day to see if prices continued falling or other chart indications such as a break of an upward trendline.
For aggressive traders, the Shooting Star pattern illustrated above could potentially be used as a sell signal. The red portion of the candle (the difference between the open and close) was so large with CSCO, that it could be considered the same as a bearish candle occuring on the next day.
However, caution would have to be used because the close of the Shooting Star rested right at the uptrend support line for Cisco Systems. Generally speaking though, a trader would wait for a confirmation candle before entering. The bullish version of the Shooting Star formation is the Inverted Hammer formation (see: Inverted Hammer) that occurs at bottoms. Another similar candlestick pattern in look and interpretation to the Shooting Star pattern is the Gravestone Doji (see: Gravestone Doji).
The information above is for informational and entertainment purposes only and does not constitute trading advice or a solicitation to buy or sell any stock, option, future, commodity, or forex product. Past performance is not necessarily an indication of future performance. Trading is inherently risky. Commodity.com shall not be liable for any special or consequential damages that result from the use of or the inability to use, the materials and information provided by this site.