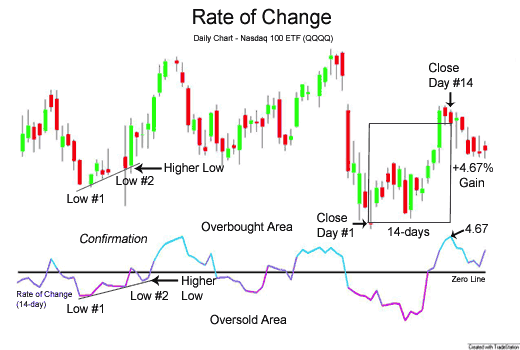
Volume Rate of Change

The formula for calculating VROC is as follows:
VROC = ((Current Volume – Volume n periods ago) / Volume n periods ago) * 100
Where:
- Current Volume is the trading volume of the current period.
- Volume n periods ago is the trading volume n periods ago.
VROC provides a percentage value that indicates how much the trading volume has increased or decreased compared to a certain number of periods ago. Positive VROC values suggest an increase in volume, indicating higher buying interest or accumulation. Negative VROC values indicate a decrease in volume, suggesting higher selling activity or distribution.
Traders use VROC to confirm price trends, identify potential trend reversals, and assess the strength of market movements. It can be particularly useful in conjunction with other technical indicators to validate trading signals and make informed decisions. High VROC values during price breakouts may indicate strong momentum, while divergence between price and VROC can signal potential trend reversals. As with any indicator, it is essential to consider VROC alongside other analysis tools to gain a comprehensive view of market conditions.
How Traders Use This To Read Buy & Sell Signals
Traders use the Volume Rate of Change (VROC) to read potential buy and sell signals as follows:
- Volume Confirmation: VROC helps confirm price trends. When the VROC and price are moving in the same direction, it supports the validity of the trend.
- Divergence: Traders look for divergences between price and VROC. If the price is making higher highs, but VROC is making lower highs, it may indicate a potential reversal.
- Spike Detection: Significant spikes in VROC can signal increased buying or selling pressure, leading to potential trading opportunities.
- Overbought and Oversold Conditions: Extreme readings in VROC can suggest overbought (high positive values) or oversold (high negative values) conditions, which may indicate a possible reversal in price.
- Confirmation with Price Patterns: Traders combine VROC with price patterns, such as breakouts or chart formations, to validate buy and sell signals.
- Crossovers: Traders observe VROC crossovers with zero or signal lines. A crossover above zero can indicate a shift to buying pressure, while a crossover below zero can indicate selling pressure.
- Volume Confirmation for Breakouts: Traders use VROC to confirm volume surges during breakout events, enhancing the likelihood of a sustained price move.
As with any technical indicator, it is essential to use VROC in combination with other tools, such as moving averages, support and resistance levels, and other oscillators, to improve the accuracy of buy and sell signals and make well-informed trading decisions. Additionally, traders should be cautious of false signals and consider the overall market context when interpreting VROC readings.