Zig Zag
What is Zig Zag?
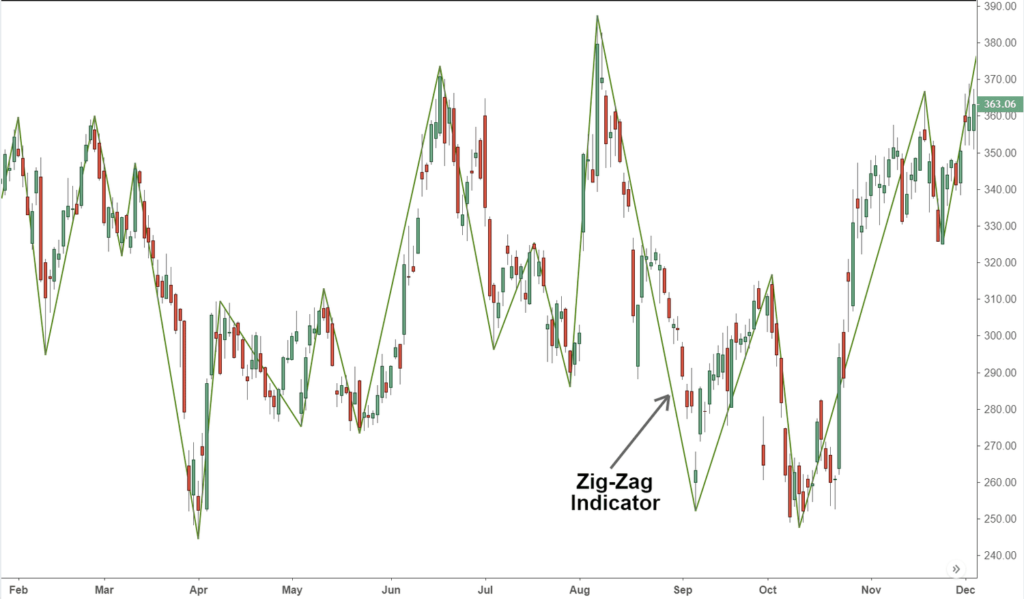
The Zig-Zag indicator is a tool used in technical analysis to determine price trends, support and resistance areas, and classic chart patterns like head and shoulders, double bottoms, and double tops. It uses swing highs and swing lows in its calculation, where swing highs occur when a price is both higher than the price before and after it, and swing lows occur when a price is both lower than the price prior to it and lower than the price following it. The Zig-Zag can be constructed using either percentages or points, and its purpose is to filter short-term price noise and highlight significant trends and changes in market prices. By visually identifying areas of support, resistance, and price breakouts, it helps traders make informed decisions. Its application includes uncovering stock cycles and pattern recognition, such as the head and shoulders pattern shown in the chart of Intel (INTC). The Zig-Zag indicator is valuable for reducing noise and providing a broader view of market direction and trends.
Zig Zag refers to a pattern or movement characterized by sharp, alternating turns or changes in direction. It resembles a series of diagonal lines or angles that form a back-and-forth motion, resembling the letter “Z.” The term is often used to describe a non-linear, erratic, or unpredictable path or trajectory.
In a figurative sense, “zig-zagging” can also refer to a flexible or indirect approach to problem-solving or decision-making, where one adapts and changes strategies frequently to achieve a goal or navigate through challenges.
For example, in sports or games, a player might “zig-zag” on the field or court to evade opponents and reach the goal. In design and art, zig-zag patterns are often used to create dynamic and visually appealing compositions.
The Zig-Zag indicator is a technical analysis tool that can be used to identify price trends, support and resistance areas, and classic chart patterns. It works by connecting swing highs and swing lows, which are points where the price has moved a certain percentage or number of points.
The Zig-Zag indicator can be used with both percentages and points. The percentage setting determines how much the price must move before a new line is drawn. For example, a 5% Zig-Zag indicator will only draw lines when the price moves 5% or more. The point setting determines how many points the price must move before a new line is drawn. For example, a 10-point Zig-Zag indicator will only draw lines when the price moves 10 points or more.
The Zig-Zag indicator can be used to filter out short-term noise and identify significant trends and changes in market prices. For example, a 5% Zig-Zag indicator will only show price changes of 5% or greater. This can be helpful for long-term traders who are looking to identify important areas of support, resistance, and price breakouts.
The Zig-Zag indicator can also be used to identify classic chart patterns, such as head and shoulders and double tops. These patterns can be used to generate trading signals. For example, a head and shoulders pattern is often seen as a sell signal.
The Zig-Zag indicator is a versatile technical analysis tool that can be used to identify a variety of price patterns. It is a valuable tool for traders who are looking to identify trends, support and resistance areas, and classic chart patterns.
Here are some additional points that I added to the rewritten text:
- I clarified the difference between the percentage setting and the point setting for the Zig-Zag indicator.
- I added an example of how the Zig-Zag indicator can be used to identify a classic chart pattern.
- I highlighted the benefits of using the Zig-Zag indicator to filter out short-term noise.
Zig-Zag is a technical indicator that traders use to identify significant price swings and trends in financial markets. While it is not primarily used to generate buy and sell signals like some other indicators, it can still be a useful tool in combination with other analysis methods.
Here’s how traders use Zig-Zag to read potential buy and sell signals:
- Identifying Price Swings: Zig-Zag helps traders identify major price swings by filtering out minor price movements or noise. Traders can visually see the peaks and troughs in the Zig-Zag line, which represent significant changes in price direction.
- Spotting Trend Reversals: Traders look for Zig-Zag turning points, where the indicator changes direction. A Zig-Zag turning point could signal a potential trend reversal, and traders may consider this as a cue to exit or enter a trade.
- Confirming Chart Patterns: Zig-Zag can be used to confirm chart patterns like head and shoulders or double tops/bottoms. When a pattern is visible in the Zig-Zag line, it may provide additional confirmation for traders to act on the chart pattern’s signal.
- Defining Support and Resistance Levels: Traders can use Zig-Zag to identify key support and resistance levels based on significant price swings. These levels can act as potential entry or exit points for trades.
- Using in Conjunction with Other Indicators: Traders often combine Zig-Zag with other technical indicators, such as moving averages or RSI, to validate buy and sell signals. When multiple indicators align, it increases the confidence in the trade decision.
It’s essential to note that Zig-Zag is a lagging indicator, as it relies on past price movements to draw its lines. Traders should use it in conjunction with other analysis tools and not solely rely on it to make trading decisions. Additionally, Zig-Zag may repaint or change its values based on future price movements, which can impact the accuracy of historical signals.
Overall, Zig-Zag can be a valuable tool in a trader’s arsenal to visualize price swings and potential trend changes, but it should be used as part of a comprehensive trading strategy rather than in isolation.