Morning Star Candlestick Pattern

The Morning Star Pattern is viewed as a bullish reversal pattern, usually occuring at the bottom of a downtrend. The pattern consists of three candlesticks:
Large Bearish Candle (Day 1)
Small Bullish or Bearish Candle (Day 2)
Large Bullish Candle (Day 3)
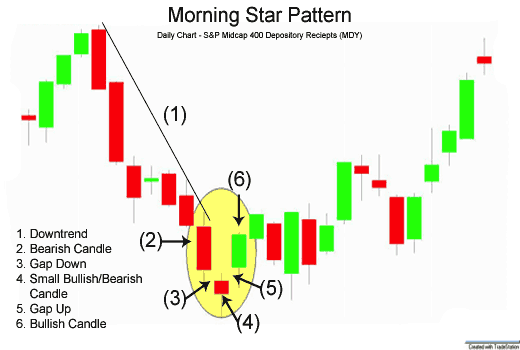
The first part of a Morning Star reversal pattern is a large bearish red candle. On the first day, bears are definitely in charge, usually making new lows.
The second day begins with a bearish gap down. It is clear from the opening of Day 2 that bears are in control. However, bears do not push prices much lower. The candlestick on Day 2 is quite small and can be bullish, bearish, or neutral (i.e. Doji).
Generally speaking, a bullish candle on Day 2 is viewed as a stronger sign of an impending reversal. But it is Day 3 that holds the most significance.
Day 3 begins with a bullish gap up, and bulls are able to press prices even further upward, often eliminating the losses seen on Day 1.
Morning Star Candlestick Chart Example

The chart below of the S&P 400 Midcap exchange traded fund (MDY) shows an example a Morning Star bullish reversal pattern that occured at the end of a downtrend:
Day 1 of the Morning Star pattern for the Midcap 400 (MDY) chart above was a strong bearish red candle. Day 2 continued Day 1’s bearish sentiment by gapping down. However, Day 2 was a Doji, which is a candlestick signifying indecision. Bears were unable to continue the large decreases of the previous day; they were only able to close slightly lower than the open.
Day 3 began with a bullish gap up. The bulls then took hold of the Midcap 400 exchange traded fund for the entire day. Also, Day 3 broke above the downward trendline that had served as resistance for MDY for the past week and a half. Both the trendline break and the classic Morning Star pattern could have given traders a potential signal to go long and buy the Midcap 400 exchange traded fund.
The bearish equivalent of the Morning Star is the Evening Star pattern (see: Evening Star).
The information above is for informational and entertainment purposes only and does not constitute trading advice or a solicitation to buy or sell any stock, option, future, commodity, or forex product. Past performance is not necessarily an indication of future performance. Trading is inherently risky. Commodity.com shall not be liable for any special or consequential damages that result from the use of or the inability to use, the materials and information provided by this site.