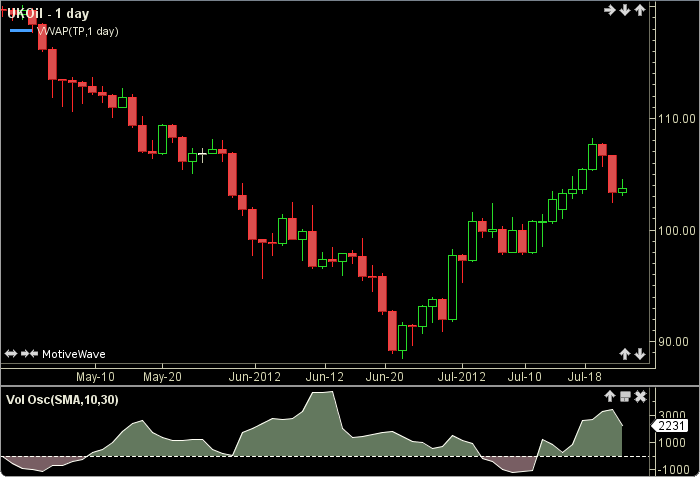
Volume Oscillator
A Volume Oscillator is a technical indicator used in financial analysis to measure the difference between two moving averages of trading volume. It provides insights into the strength and momentum of volume trends.
The most common type of Volume Oscillator is the “Percentage Volume Oscillator” (PVO), which calculates the percentage difference between a short-term volume moving average and a long-term volume moving average.
The formula for calculating the Percentage Volume Oscillator (PVO) is as follows:
PVO = ((Short-term Volume MA – Long-term Volume MA) / Long-term Volume MA) * 100
Where:
- Short-term Volume MA: Moving average of volume over a short period (e.g., 12 days).
- Long-term Volume MA: Moving average of volume over a longer period (e.g., 26 days).
Traders use Volume Oscillators to identify trends and potential changes in volume momentum. Positive values suggest increasing volume strength, while negative values indicate declining volume strength.
Volume Oscillators are often used in conjunction with other technical indicators and price analysis to validate trends and make trading decisions. They can help identify potential trend reversals, confirm price movements, and assess the overall market sentiment based on volume activity.
Using the Volume Oscillator to buy and sell involves several steps to analyze the volume trends effectively. Here’s a step-by-step process on how to use the Volume Oscillator for trading decisions:
- Plot the Volume Oscillator: Set up your trading platform to display the Volume Oscillator on the chart of the asset you want to trade. The Volume Oscillator typically appears as a line chart or histogram below the price chart.
- Identify Trend Direction: Analyze the Volume Oscillator to identify the overall trend direction. Positive values indicate increasing volume momentum, while negative values suggest decreasing volume momentum.
- Confirm Price Trends: Compare the Volume Oscillator with the price chart to confirm price trends. Look for alignment between volume and price movements. When volume and price move in the same direction, it confirms the trend’s strength.
- Look for Divergence: Pay attention to divergences between the Volume Oscillator and price. Divergence occurs when the price is making higher highs or lower lows, but the Volume Oscillator is making lower highs or higher lows. Divergence can indicate potential trend reversals.
- Observe Volume Spikes: Watch for significant spikes in the Volume Oscillator. Unusually high volume may signal strong interest and potential price changes.
- Set Entry and Exit Points: Based on the Volume Oscillator’s readings and its alignment with price movements, determine entry and exit points for your trades. For example, consider entering a long position when the Volume Oscillator shows increasing volume and confirms an uptrend.
- Use Other Indicators: Combine the Volume Oscillator with other technical indicators and analysis tools like moving averages, trendlines, and support/resistance levels to strengthen your trading strategy.
- Apply Risk Management: Always implement proper risk management techniques, including setting stop-loss orders, to protect your capital from significant losses.
- Practice and Analyze: Use a demo account or paper trading to practice your trading strategy using the Volume Oscillator. Analyze past trades to learn from successes and mistakes.
- Stay Informed: Stay updated on market news and events that may impact trading volume. Volume activity can change due to news releases, economic events, or market sentiment shifts.
Remember that trading involves risks, and no indicator guarantees profits. The Volume Oscillator should be used in conjunction with other analysis methods to make informed trading decisions. Additionally, consider the overall market context and use proper risk management to manage potential losses.