Volume Accumulation
What is Volume Accumulation?
Volume Accumulation, also known as On-Balance Volume (OBV), is a technical indicator used in financial analysis to assess the flow of volume in a financial asset over a specific period. It was developed by Joseph Granville.
The Volume Accumulation indicator takes into account the volume of a financial asset on days when the price closes higher and subtracts the volume on days when the price closes lower. The resulting cumulative volume value helps traders determine the strength of buying or selling pressure behind the price movements.
The formula for calculating On-Balance Volume (OBV) is as follows:
OBV = Previous OBV + Volume (if the closing price is higher than the previous closing price) Previous OBV – Volume (if the closing price is lower than the previous closing price) Previous OBV (if the closing price is the same as the previous closing price)
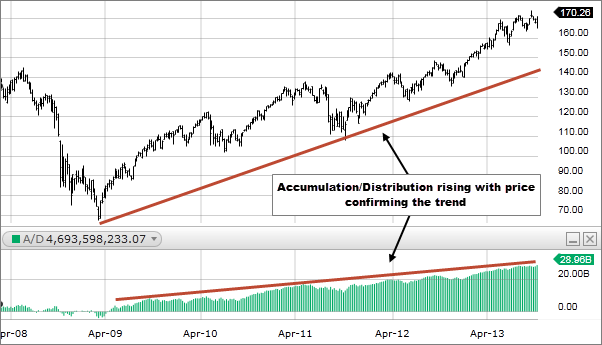
Traders use Volume Accumulation to identify trends and potential trend reversals. Rising OBV values suggest an increase in buying pressure, indicating a potential uptrend, while falling OBV values suggest an increase in selling pressure, indicating a potential downtrend.
Volume Accumulation can be used alongside other technical indicators and price analysis to make more informed trading decisions and validate trends. It provides valuable insights into market sentiment and can help identify shifts in supply and demand dynamics.
How to buy and Sell using Volume Accumulation?
Buying and selling using Volume Accumulation (On-Balance Volume – OBV) involves a process of analyzing the indicator in conjunction with price movements to make trading decisions. Here’s a step-by-step guide on how to use Volume Accumulation for buying and selling:
Buying using Volume Accumulation (OBV):
- Plot the OBV Indicator: Set up your trading platform to display the On-Balance Volume (OBV) indicator on the price chart of the asset you want to trade.
- Identify Uptrends: Look for periods when the OBV is rising steadily or making higher highs. This indicates an accumulation of volume on days when the price closes higher, potentially signaling a strengthening uptrend.
- Confirm Price Trends: Verify that the OBV aligns with the price chart. Rising OBV should correspond to price increases, confirming the uptrend’s strength.
- Watch for Divergence: Pay attention to divergences between the OBV and price. If the price is making higher highs, but the OBV is making lower highs, it may signal a potential trend reversal.
- Entry Point: Consider entering a long position when the OBV shows increasing volume during an uptrend, confirming the upward momentum.
Selling using Volume Accumulation (OBV):
- Analyze Downtrends: Observe periods when the OBV is declining or making lower lows. This suggests volume accumulation on days when the price closes lower, potentially signaling a strengthening downtrend.
- Confirm Price Trends: Verify that the OBV aligns with the price chart. Falling OBV should correspond to price decreases, confirming the downtrend’s strength.
- Watch for Divergence: Look for divergences between the OBV and price. If the price is making lower lows, but the OBV is making higher lows, it may signal a potential trend reversal.
- Exit Point: Consider exiting a long position or entering a short position when the OBV shows increasing volume during a downtrend, confirming the downward momentum.
- Use Risk Management: Always apply proper risk management techniques, such as setting stop-loss orders, to protect your capital from significant losses.
Pros & Cons
It’s crucial to use Volume Accumulation alongside other technical indicators and analysis tools for comprehensive decision-making. Additionally, consider the overall market context, news events, and economic factors that may influence trading decisions. Practice using Volume Accumulation in a demo account or paper trading to gain experience before trading with real money.
Pros of Volume Accumulation (On-Balance Volume – OBV):
- Trend Confirmation: OBV helps confirm price trends by assessing the flow of volume in relation to price movements. Rising OBV confirms uptrends, while falling OBV confirms downtrends.
- Early Trend Reversal Indication: Divergence between OBV and price can provide early signals of potential trend reversals, alerting traders to possible changes in market sentiment.
- Simple and Effective: OBV is a straightforward indicator that can be easily understood and used by traders of all experience levels.
- Non-Price-Based Indicator: OBV is not based solely on price data, providing an alternative perspective on market dynamics based on volume activity.
Cons of Volume Accumulation (On-Balance Volume – OBV):
- Lagging Indicator: Like many technical indicators, OBV relies on historical data, which means it may lag behind the most current price movements.
- Limited to Price and Volume: OBV only considers price and volume data, not taking into account other fundamental or macroeconomic factors that may influence the market.
- False Signals: Like any indicator, OBV can generate false signals, especially in choppy or sideways markets, leading to potential trading losses.
- Not Suitable for All Assets: OBV is more effective in certain types of assets with significant volume data, such as stocks or forex, and may be less reliable for illiquid or low-volume assets.
- Sensitivity to Price Fluctuations: OBV can be sensitive to small price fluctuations, potentially producing noise and false signals in highly volatile markets.
It’s important to use Volume Accumulation (OBV) in conjunction with other technical indicators, price analysis, and fundamental factors to validate signals and make well-informed trading decisions. As with any trading tool, it’s essential to practice and test OBV in a demo or paper trading environment before applying it to real trades. Additionally, risk management techniques should always be employed to protect capital from potential losses.