Harami Candlestick Pattern

The Harami (meaning “pregnant” in Japanese) Candlestick Pattern is considered a reversal pattern. The pattern consists of two Candlesticks:
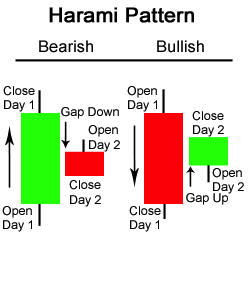
- Larger Bullish or Bearish Candle (Day 1)
- Smaller Bullish or Bearish Candle (Day 2)
The Harami Pattern is considered either bullish or bearish based on the criteria below:
Bearish Harami: A bearish Harami occurs when there is a large bullish green candle on Day 1 followed by a smaller bearish or bullish candle on Day 2. The most important aspect of the bearish Harami is that prices gapped down on Day 2 and were unable to move higher back to the close of Day 1. This is a sign that uncertainty could be entering the market.
Bullish Harami: A bullish Harami occurs when there is a large bearish red candle on Day 1 followed by a smaller bearish or bullish candle on Day 2. Again, the most important aspect of the bullish Harami is that prices gapped up on Day 2 and price was held up and unable to move lower back to the bearish close of Day 1.
Harami Candlestick Chart Example
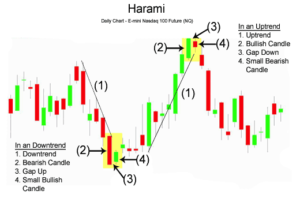
The chart below of the Nasdaq 100 E-mini Futures contract shows an example of both a bullish and bearish Harami candlestick pattern:
The first Harami pattern shown above on the chart of the E-mini Nasdaq 100 Future is a bullish reversal Harami. First there was a long bearish red candle. Second, the market gapped up at the open. In the case above, Day 2 was a bullish candlestick, which made the bullish Harami look even more bullish.
Harami Candlestick Potential Buy Signal
A buy signal could be triggered when the day after the bullish Harami occured, price rose higher, closing above the downward resistance trendline. A bullish Harami pattern and a trendline break is a combination that potentially could resulst in a buy signal.
The second Harami pattern shown above on the chart of the E-mini Nasdaq 100 Future is a bearish reversal Harami. The first candle was a long bullish green candle. On the second candle, the market gapped down at the open. The chart above of the e-mini shows that Day 2 was a bearish candlestick; this made the bearish Harami look even more bearish.
Harami Candlestick Potential Sell Signal A sell signal could be triggered when the day after the bearish Harami occured, price fell even further down, closing below the upward support trendline. When combined, a bearish Harami pattern and a trendline break might be interpreted as a potential sell signal.
A somewhat opposite two candlestick reversal pattern is the Bearish Engulfing Pattern (see: Bearish Engulfing Pattern) and the Bullish Engulfing Pattern (see: Bullish Engulfing Pattern).
The information above is for informational and entertainment purposes only and does not constitute trading advice or a solicitation to buy or sell any stock, option, future, commodity, or forex product. Past performance is not necessarily an indication of future performance. Trading is inherently risky. Commodity.com shall not be liable for any special or consequential damages that result from the use of or the inability to use, the materials and information provided by this site.