Swing Index
What is Swing Index?
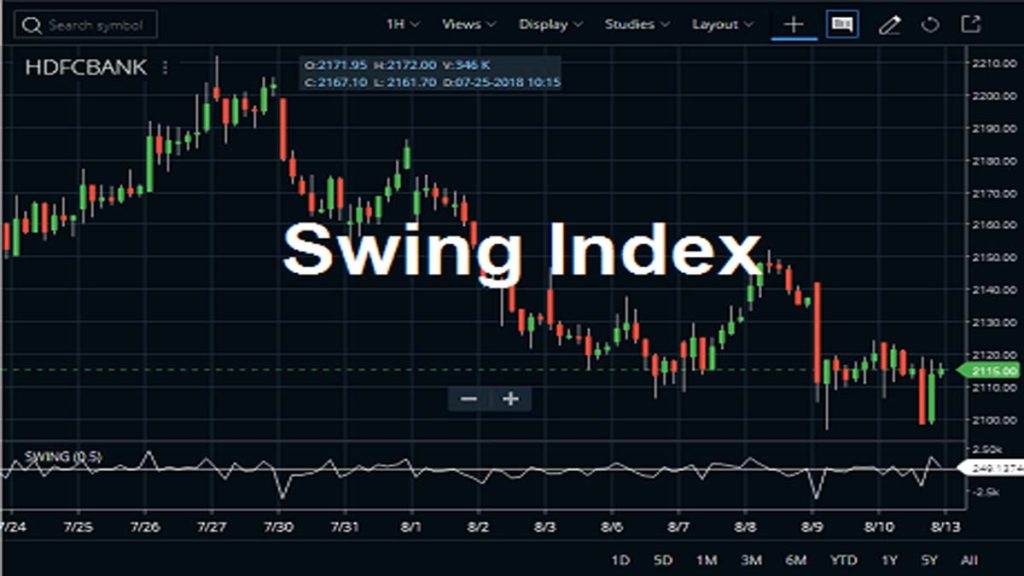
The Swing Index is a technical indicator used in financial analysis to help traders identify potential trend reversals and assess market momentum. It was developed by Welles Wilder, a renowned technical analyst, and is often used in conjunction with other indicators to make trading decisions.
The Swing Index is designed to calculate price bars’ relationship, taking into account the open, high, low, and close prices. It generates a value that indicates the strength of the current trend and the likelihood of a trend reversal. The Swing Index can be positive or negative, and its values are used to plot the Swing Index line on a price chart.
Traders use the Swing Index to detect divergences between price and the indicator, as well as to identify potential entry and exit points. It can help determine when a trend is losing momentum or gaining strength, allowing traders to make more informed decisions in their trading strategies.
As with any technical indicator, the Swing Index should be used alongside other tools and analysis methods to validate signals and improve the accuracy of trading decisions.
How to Buy and Sell using Swing Inedx.
Buying and selling using the Swing Index involves a combination of the Swing Index value and price analysis to make trading decisions. Here’s a step-by-step guide on how to use the Swing Index for buying and selling:
Buying using Swing Index:
- Plot the Swing Index: Set up your trading platform to display the Swing Index indicator on the price chart of the asset you want to trade.
- Identify Trend Strength: Analyze the Swing Index value to determine the strength of the current trend. Positive values indicate an uptrend, while negative values suggest a downtrend.
- Look for Divergence: Pay attention to divergences between the Swing Index and price movements. If the price is making higher highs, but the Swing Index is making lower highs, it may signal a potential trend reversal and a buying opportunity.
- Confirm Price Patterns: Use the Swing Index in combination with other technical indicators and price patterns to confirm potential entry points. Look for bullish signals, such as breakouts from chart patterns or support levels.
- Entry Point: Consider entering a long position when the Swing Index confirms an uptrend, and the price indicates a bullish trend continuation or reversal.
Selling using Swing Index:
- Analyze Trend Strength: Observe the Swing Index value to identify the strength of the current trend. Negative values indicate a downtrend, while positive values suggest an uptrend.
- Watch for Divergence: Look for divergences between the Swing Index and price movements. If the price is making lower lows, but the Swing Index is making higher lows, it may signal a potential trend reversal and a selling opportunity.
- Confirm Price Patterns: Use the Swing Index alongside other technical indicators and price patterns to confirm potential exit points. Look for bearish signals, such as breakdowns from chart patterns or resistance levels.
- Exit Point: Consider exiting a long position or entering a short position when the Swing Index confirms a downtrend, and the price indicates a bearish trend continuation or reversal.
- Risk Management: Always apply proper risk management techniques, such as setting stop-loss orders, to protect your capital from significant losses.
Pros & Cons
Remember that the Swing Index is just one tool in the trader’s toolkit. Combine it with other technical analysis methods and fundamental analysis to make well-informed trading decisions. Additionally, practice using the Swing Index in a demo account or paper trading before applying it to real trades.
Pros of Swing Index:
- Trend Identification: The Swing Index helps identify trend strength and potential trend reversals, aiding traders in making informed decisions.
- Divergence Detection: It can signal divergences between the Swing Index and price movements, providing early indications of potential trend changes.
- Objective Indicator: The Swing Index is a mathematical calculation, providing a clear and objective signal for traders.
- Simple to Use: The Swing Index is relatively easy to interpret and use, making it accessible to traders of all experience levels.
Cons of Swing Index:
- Lagging Indicator: Like many technical indicators, the Swing Index relies on historical data, leading to some lag behind current market conditions.
- False Signals: As with any indicator, the Swing Index may produce false signals, especially in choppy or unpredictable market conditions.
- Dependent on Market Volatility: The effectiveness of the Swing Index may vary depending on the level of market volatility.
- Not Standalone: The Swing Index should be used in conjunction with other analysis methods and indicators for more reliable trading decisions.
As with any technical indicator, the Swing Index is not foolproof and should be used in combination with other tools and analysis techniques. Traders should also practice risk management and thoroughly test their strategies before applying them to real trading scenarios.